29
/
en
AIzaSyAYiBZKx7MnpbEhh9jyipgxe19OcubqV5w
April 1, 2024
226347
Portugal
PRT
true
2
1
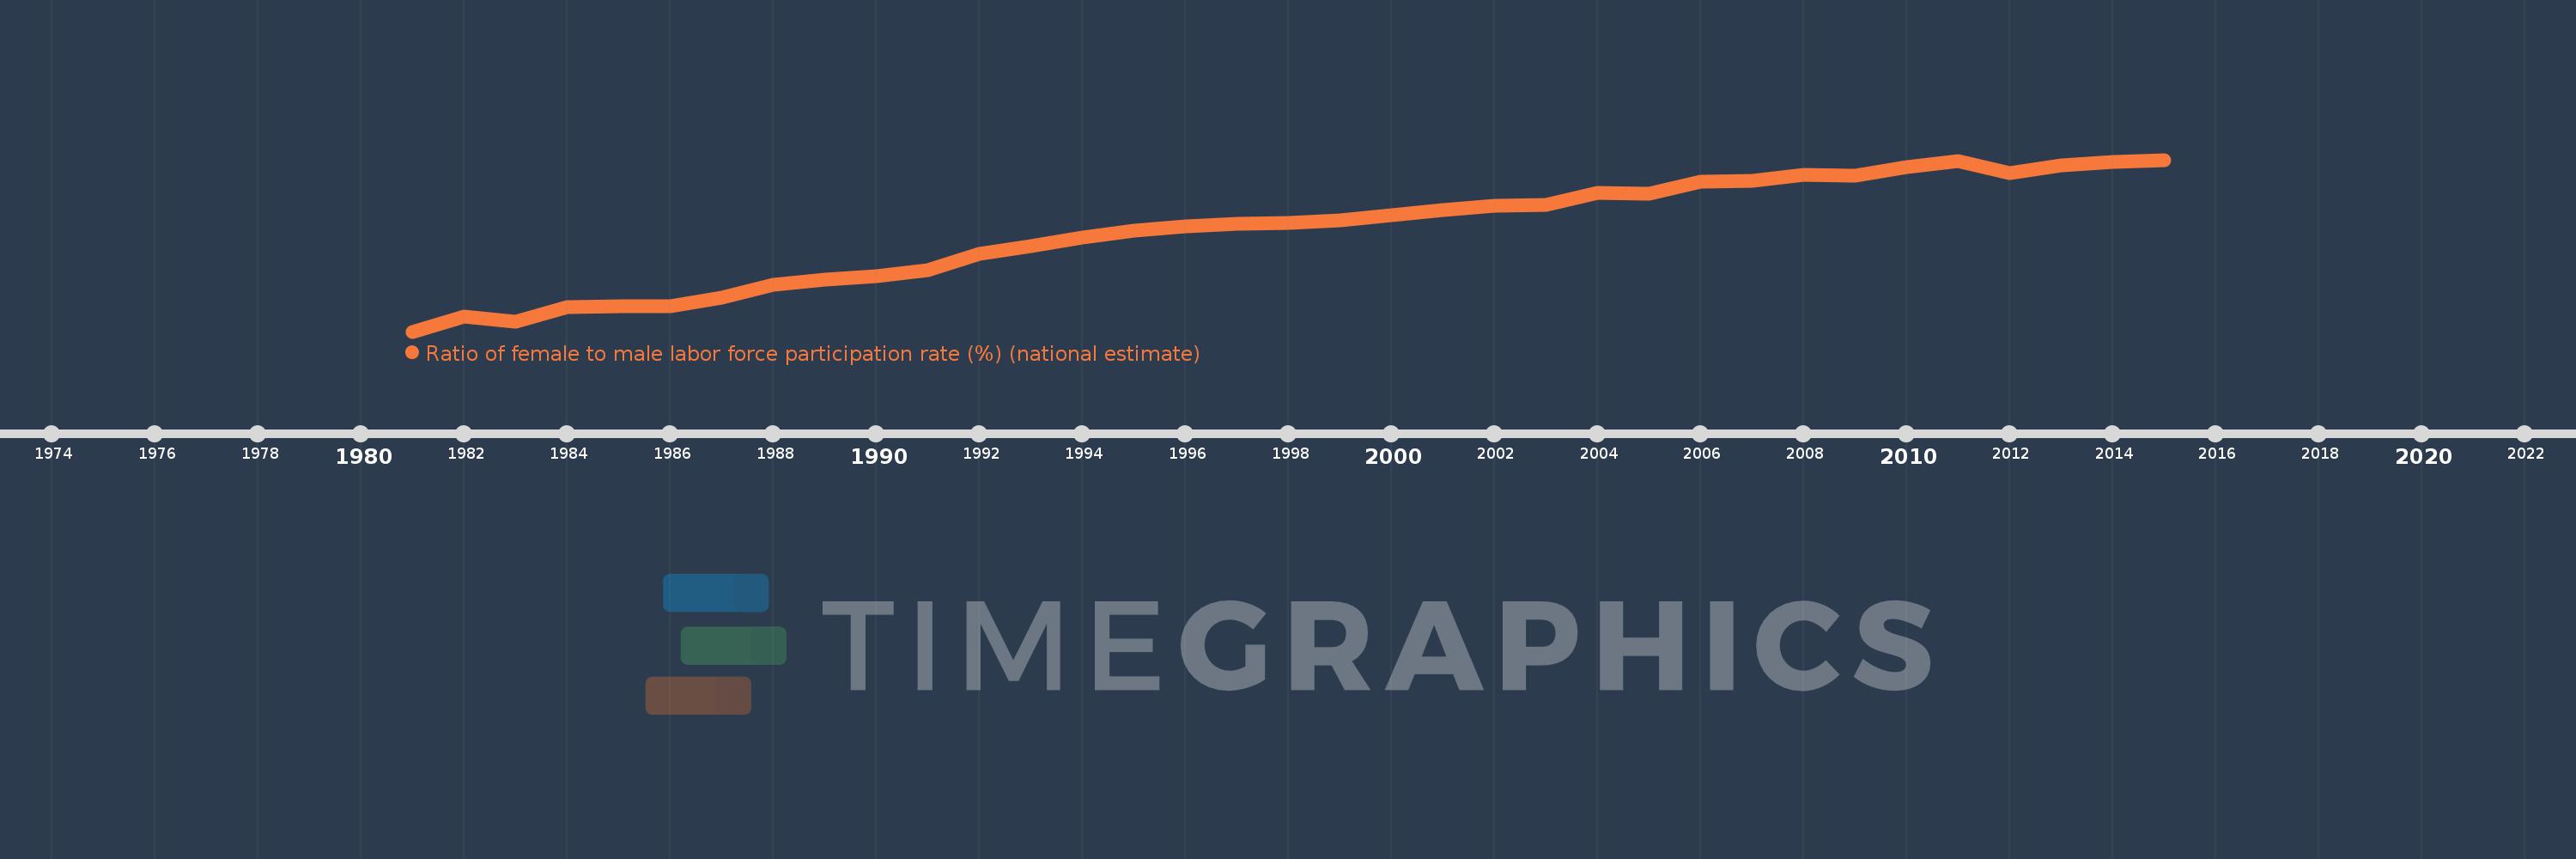
Ratio of female to male labor force participation rate (%) (national estimate)
2015,2014,2013,2012,2011,2010,2009,2008,2007,2006,2005,2004,2003,2002,2001,2000,1999,1998,1997,1996,1995,1994,1993,1992,1991,1990,1989,1988,1987,1986,1985,1984,1983,1982,1981
This statistics in other country:
AfghanistanAlbaniaAlgeriaAmerican SamoaAntigua and BarbudaArab WorldArgentinaArmeniaArubaAustraliaAustriaAzerbaijanBahamas, TheBahrainBangladeshBarbadosBelarusBelgiumBelizeBeninBermudaBhutanBoliviaBosnia and HerzegovinaBotswanaBrazilBritish Virgin IslandsBrunei DarussalamBulgariaBurkina FasoBurundiCabo VerdeCambodiaCameroonCanadaCaribbean small statesCayman IslandsCentral African RepublicCentral Europe and the BalticsChadChileColombiaComorosCongo, Dem. Rep.Congo, Rep.Costa RicaCote d'IvoireCroatiaCubaCyprusCzech RepublicDenmarkDjiboutiDominicaDominican RepublicEarly-demographic dividendEcuadorEgypt, Arab Rep.El SalvadorEquatorial GuineaEstoniaEthiopiaEuro areaEurope & Central AsiaEurope & Central Asia (excluding high income)Europe & Central Asia (IDA & IBRD countries)European UnionFaroe IslandsFijiFinlandFranceFrench PolynesiaGabonGambia, TheGeorgiaGermanyGhanaGibraltarGreeceGrenadaGuamGuatemalaGuineaGuyanaHaitiHigh incomeHondurasHong Kong SAR, ChinaHungaryIBRD onlyIcelandIDA blendIndiaIndonesiaIran, Islamic Rep.IraqIrelandIsle of ManIsraelItalyJamaicaJapanJordanKazakhstanKenyaKiribatiKorea, Rep.KosovoKuwaitKyrgyz RepublicLao PDRLatin America & Caribbean Latin America & Caribbean (excluding high income)Latin America & the Caribbean (IDA & IBRD countries)LatviaLebanonLesothoLiberiaLibyaLiechtensteinLithuaniaLower middle incomeLuxembourgMacao SAR, ChinaMacedonia, FYRMadagascarMalawiMalaysiaMaldivesMaliMaltaMarshall IslandsMauritaniaMauritiusMexicoMiddle East & North AfricaMiddle East & North Africa (excluding high income)Middle East & North Africa (IDA & IBRD countries)MoldovaMonacoMongoliaMontenegroMoroccoMozambiqueMyanmarNamibiaNauruNepalNetherlandsNew CaledoniaNew ZealandNicaraguaNigerNigeriaNorth AmericaNorthern Mariana IslandsNorwayOECD membersOmanPakistanPalauPanamaPapua New GuineaParaguayPeruPhilippinesPolandPortugalPost-demographic dividendPuerto RicoQatarRomaniaRussian FederationRwandaSamoaSan MarinoSao Tome and PrincipeSaudi ArabiaSenegalSerbiaSeychellesSierra LeoneSingaporeSlovak RepublicSloveniaSolomon IslandsSouth AfricaSouth AsiaSouth Asia (IDA & IBRD)South SudanSpainSri LankaSt. Kitts and NevisSt. LuciaSt. Vincent and the GrenadinesSudanSurinameSwazilandSwedenSwitzerlandSyrian Arab RepublicTajikistanTanzaniaThailandTimor-LesteTogoTongaTrinidad and TobagoTunisiaTurkeyTurks and Caicos IslandsTuvaluUgandaUkraineUnited Arab EmiratesUnited KingdomUnited StatesUruguayVanuatuVenezuela, RBVietnamVirgin Islands (U.S.)West Bank and GazaYemen, Rep.ZambiaZimbabwe Timeline:
This timeline shows a graph from 1981 to 2015 of Portugal. No data until 1980. Number of actual observations by date: 35.
Source name:
World Development Indicators
Source organization:
International Labour Organization, Key Indicators of the Labour Market database.
Categories, topics:
Social Protection & Labor
Last updated:
apr 23, 2017
Indicators value changes by year
Minimum:
56.675
jan 1, 1981
Maximum:
83.411
jan 1, 2015
At the date of observation
Value
Absolute change
Change from previous value
jan 1, 1981
56.675
+56.675
0.0%
jan 1, 1982
59.004
+2.329
4.11%
jan 1, 1983
58.269
-0.735
-1.25%
jan 1, 1984
60.426
+2.157
3.7%
jan 1, 1985
60.619
+0.194
0.32%
jan 1, 1986
60.638
+0.019
0.03%
jan 1, 1987
61.989
+1.351
2.23%
jan 1, 1988
63.95
+1.961
3.16%
jan 1, 1989
64.812
+0.862
1.35%
jan 1, 1990
65.284
+0.471
0.73%
jan 1, 1991
66.248
+0.965
1.48%
jan 1, 1992
68.733
+2.485
3.75%
jan 1, 1993
69.915
+1.182
1.72%
jan 1, 1994
71.326
+1.41
2.02%
jan 1, 1995
72.409
+1.083
1.52%
jan 1, 1996
73.009
+0.6
0.83%
jan 1, 1997
73.472
+0.464
0.63%
jan 1, 1998
73.621
+0.149
0.2%
jan 1, 1999
73.932
+0.31
0.42%
jan 1, 2000
74.785
+0.853
1.15%
jan 1, 2001
75.61
+0.825
1.1%
jan 1, 2002
76.211
+0.601
0.79%
jan 1, 2003
76.412
+0.202
0.26%
jan 1, 2004
78.286
+1.873
2.45%
jan 1, 2005
78.129
-0.156
-0.2%
jan 1, 2006
80.029
+1.899
2.43%
jan 1, 2007
80.087
+0.058
0.07%
jan 1, 2008
81.042
+0.955
1.19%
jan 1, 2009
80.987
-0.055
-0.07%
jan 1, 2010
82.275
+1.288
1.59%
jan 1, 2011
83.185
+0.91
1.11%
jan 1, 2012
81.371
-1.813
-2.18%
jan 1, 2013
82.504
+1.133
1.39%
jan 1, 2014
83.103
+0.599
0.73%
jan 1, 2015
83.411
+0.308
0.37%
Ranking of countries by current statistics by years


Comments: