29
/
en
AIzaSyAYiBZKx7MnpbEhh9jyipgxe19OcubqV5w
April 1, 2024
276113
United Kingdom
GBR
true
2
1
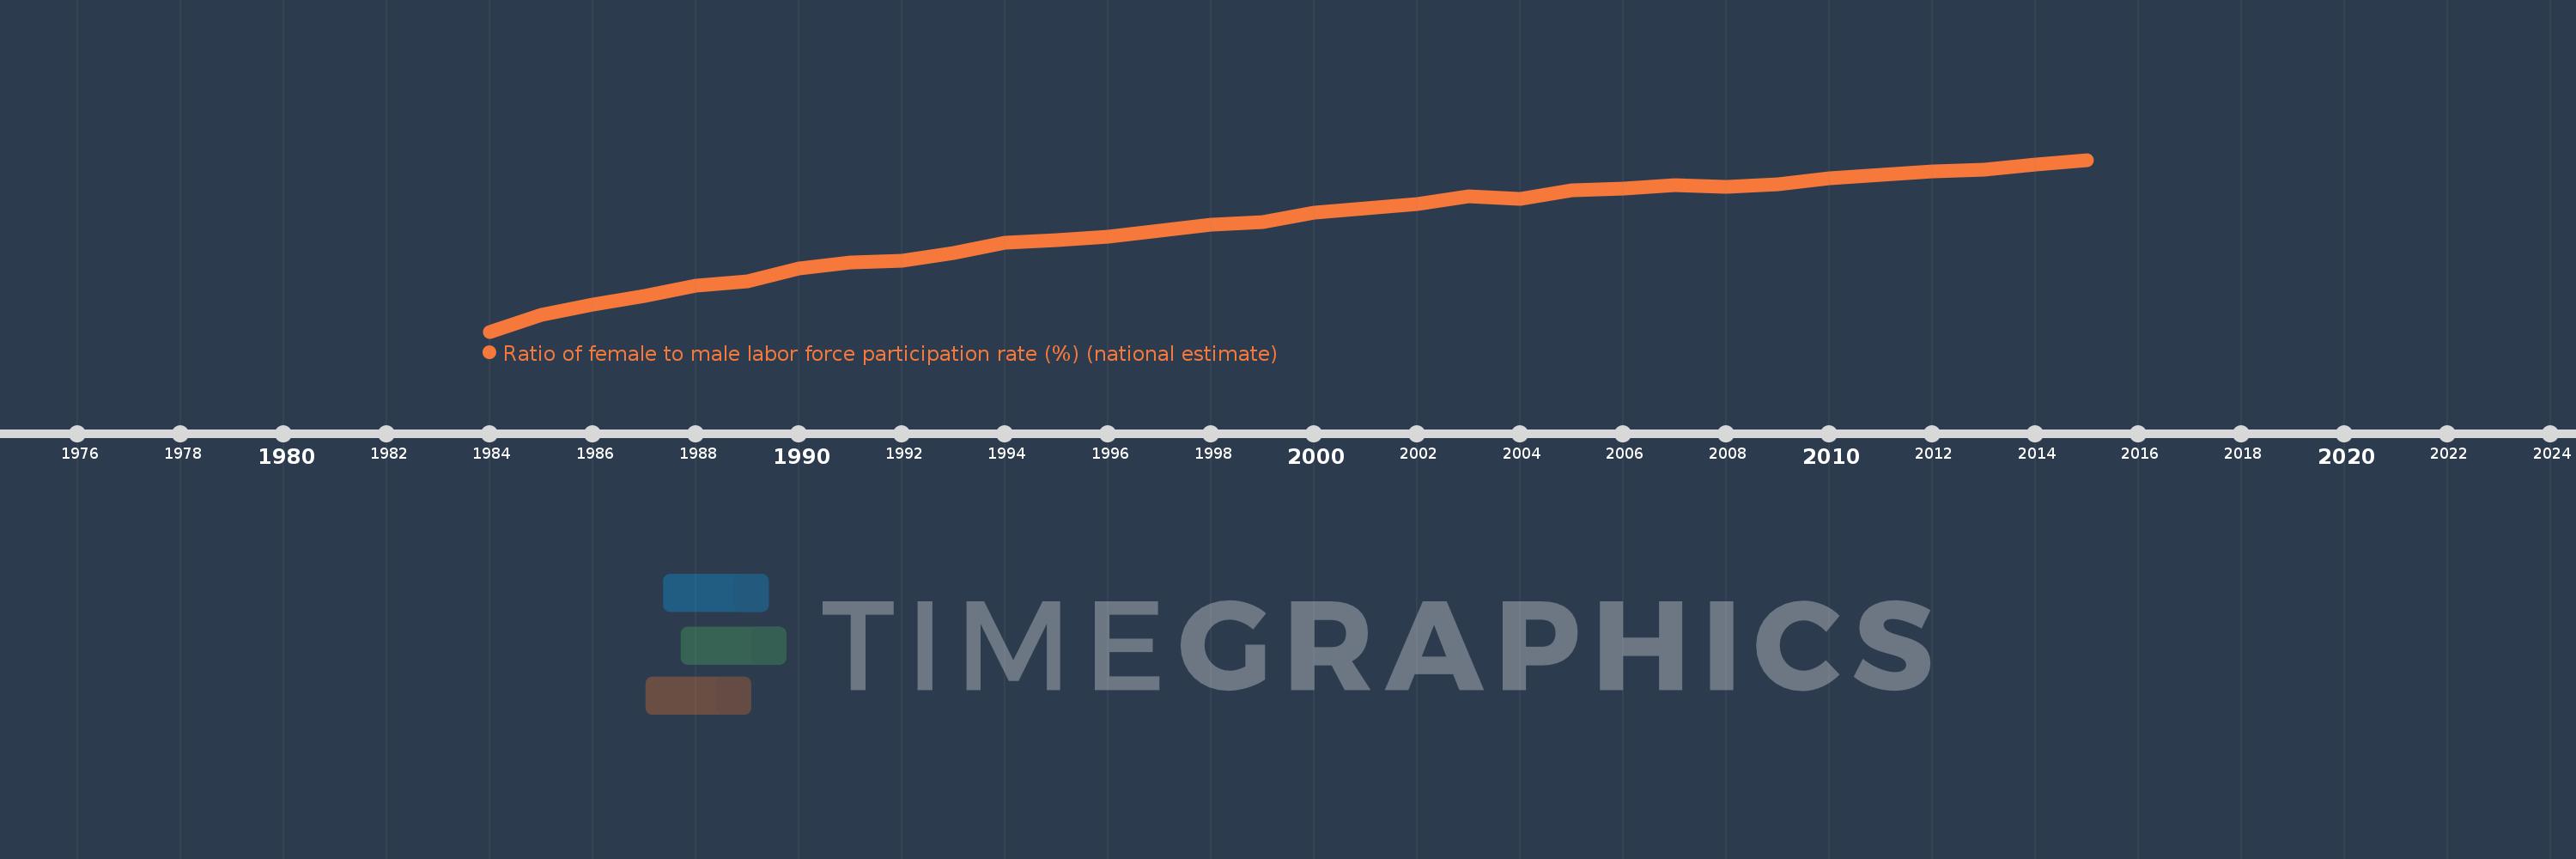
Ratio of female to male labor force participation rate (%) (national estimate)
2015,2014,2013,2012,2011,2010,2009,2008,2007,2006,2005,2004,2003,2002,2001,2000,1999,1998,1997,1996,1995,1994,1993,1992,1991,1990,1989,1988,1987,1986,1985,1984
This statistics in other country:
AfghanistanAlbaniaAlgeriaAmerican SamoaAntigua and BarbudaArab WorldArgentinaArmeniaArubaAustraliaAustriaAzerbaijanBahamas, TheBahrainBangladeshBarbadosBelarusBelgiumBelizeBeninBermudaBhutanBoliviaBosnia and HerzegovinaBotswanaBrazilBritish Virgin IslandsBrunei DarussalamBulgariaBurkina FasoBurundiCabo VerdeCambodiaCameroonCanadaCaribbean small statesCayman IslandsCentral African RepublicCentral Europe and the BalticsChadChileColombiaComorosCongo, Dem. Rep.Congo, Rep.Costa RicaCote d'IvoireCroatiaCubaCyprusCzech RepublicDenmarkDjiboutiDominicaDominican RepublicEarly-demographic dividendEcuadorEgypt, Arab Rep.El SalvadorEquatorial GuineaEstoniaEthiopiaEuro areaEurope & Central AsiaEurope & Central Asia (excluding high income)Europe & Central Asia (IDA & IBRD countries)European UnionFaroe IslandsFijiFinlandFranceFrench PolynesiaGabonGambia, TheGeorgiaGermanyGhanaGibraltarGreeceGrenadaGuamGuatemalaGuineaGuyanaHaitiHigh incomeHondurasHong Kong SAR, ChinaHungaryIBRD onlyIcelandIDA blendIndiaIndonesiaIran, Islamic Rep.IraqIrelandIsle of ManIsraelItalyJamaicaJapanJordanKazakhstanKenyaKiribatiKorea, Rep.KosovoKuwaitKyrgyz RepublicLao PDRLatin America & Caribbean Latin America & Caribbean (excluding high income)Latin America & the Caribbean (IDA & IBRD countries)LatviaLebanonLesothoLiberiaLibyaLiechtensteinLithuaniaLower middle incomeLuxembourgMacao SAR, ChinaMacedonia, FYRMadagascarMalawiMalaysiaMaldivesMaliMaltaMarshall IslandsMauritaniaMauritiusMexicoMiddle East & North AfricaMiddle East & North Africa (excluding high income)Middle East & North Africa (IDA & IBRD countries)MoldovaMonacoMongoliaMontenegroMoroccoMozambiqueMyanmarNamibiaNauruNepalNetherlandsNew CaledoniaNew ZealandNicaraguaNigerNigeriaNorth AmericaNorthern Mariana IslandsNorwayOECD membersOmanPakistanPalauPanamaPapua New GuineaParaguayPeruPhilippinesPolandPortugalPost-demographic dividendPuerto RicoQatarRomaniaRussian FederationRwandaSamoaSan MarinoSao Tome and PrincipeSaudi ArabiaSenegalSerbiaSeychellesSierra LeoneSingaporeSlovak RepublicSloveniaSolomon IslandsSouth AfricaSouth AsiaSouth Asia (IDA & IBRD)South SudanSpainSri LankaSt. Kitts and NevisSt. LuciaSt. Vincent and the GrenadinesSudanSurinameSwazilandSwedenSwitzerlandSyrian Arab RepublicTajikistanTanzaniaThailandTimor-LesteTogoTongaTrinidad and TobagoTunisiaTurkeyTurks and Caicos IslandsTuvaluUgandaUkraineUnited Arab EmiratesUnited KingdomUnited StatesUruguayVanuatuVenezuela, RBVietnamVirgin Islands (U.S.)West Bank and GazaYemen, Rep.ZambiaZimbabwe Timeline:
This timeline shows a graph from 1984 to 2015 of United Kingdom. No data until 1983. Number of actual observations by date: 32.
Source name:
World Development Indicators
Source organization:
International Labour Organization, Key Indicators of the Labour Market database.
Categories, topics:
Social Protection & Labor
Last updated:
apr 23, 2017
Indicators value changes by year
At the date of observation
Value
Absolute change
Change from previous value
jan 1, 1984
62.21
+62.21
0.0%
jan 1, 1985
64.218
+2.008
3.23%
jan 1, 1986
65.457
+1.239
1.93%
jan 1, 1987
66.576
+1.119
1.71%
jan 1, 1988
67.751
+1.174
1.76%
jan 1, 1989
68.286
+0.535
0.79%
jan 1, 1990
69.933
+1.647
2.41%
jan 1, 1991
70.565
+0.632
0.9%
jan 1, 1992
70.867
+0.303
0.43%
jan 1, 1993
71.781
+0.914
1.29%
jan 1, 1994
73.018
+1.237
1.72%
jan 1, 1995
73.324
+0.306
0.42%
jan 1, 1996
73.736
+0.412
0.56%
jan 1, 1997
74.507
+0.771
1.05%
jan 1, 1998
75.176
+0.669
0.9%
jan 1, 1999
75.496
+0.319
0.42%
jan 1, 2000
76.638
+1.142
1.51%
jan 1, 2001
77.208
+0.57
0.74%
jan 1, 2002
77.73
+0.522
0.68%
jan 1, 2003
78.674
+0.944
1.22%
jan 1, 2004
78.336
-0.339
-0.43%
jan 1, 2005
79.365
+1.029
1.31%
jan 1, 2006
79.598
+0.233
0.29%
jan 1, 2007
79.971
+0.374
0.47%
jan 1, 2008
79.799
-0.172
-0.22%
jan 1, 2009
80.114
+0.315
0.39%
jan 1, 2010
80.836
+0.721
0.9%
jan 1, 2011
81.304
+0.469
0.58%
jan 1, 2012
81.686
+0.382
0.47%
jan 1, 2013
81.858
+0.172
0.21%
jan 1, 2014
82.558
+0.7
0.86%
jan 1, 2015
83.09
+0.532
0.64%
Ranking of countries by current statistics by years


Comments: