29
/
en
AIzaSyAYiBZKx7MnpbEhh9jyipgxe19OcubqV5w
April 1, 2024
74339
Austria
AUT
true
2
1
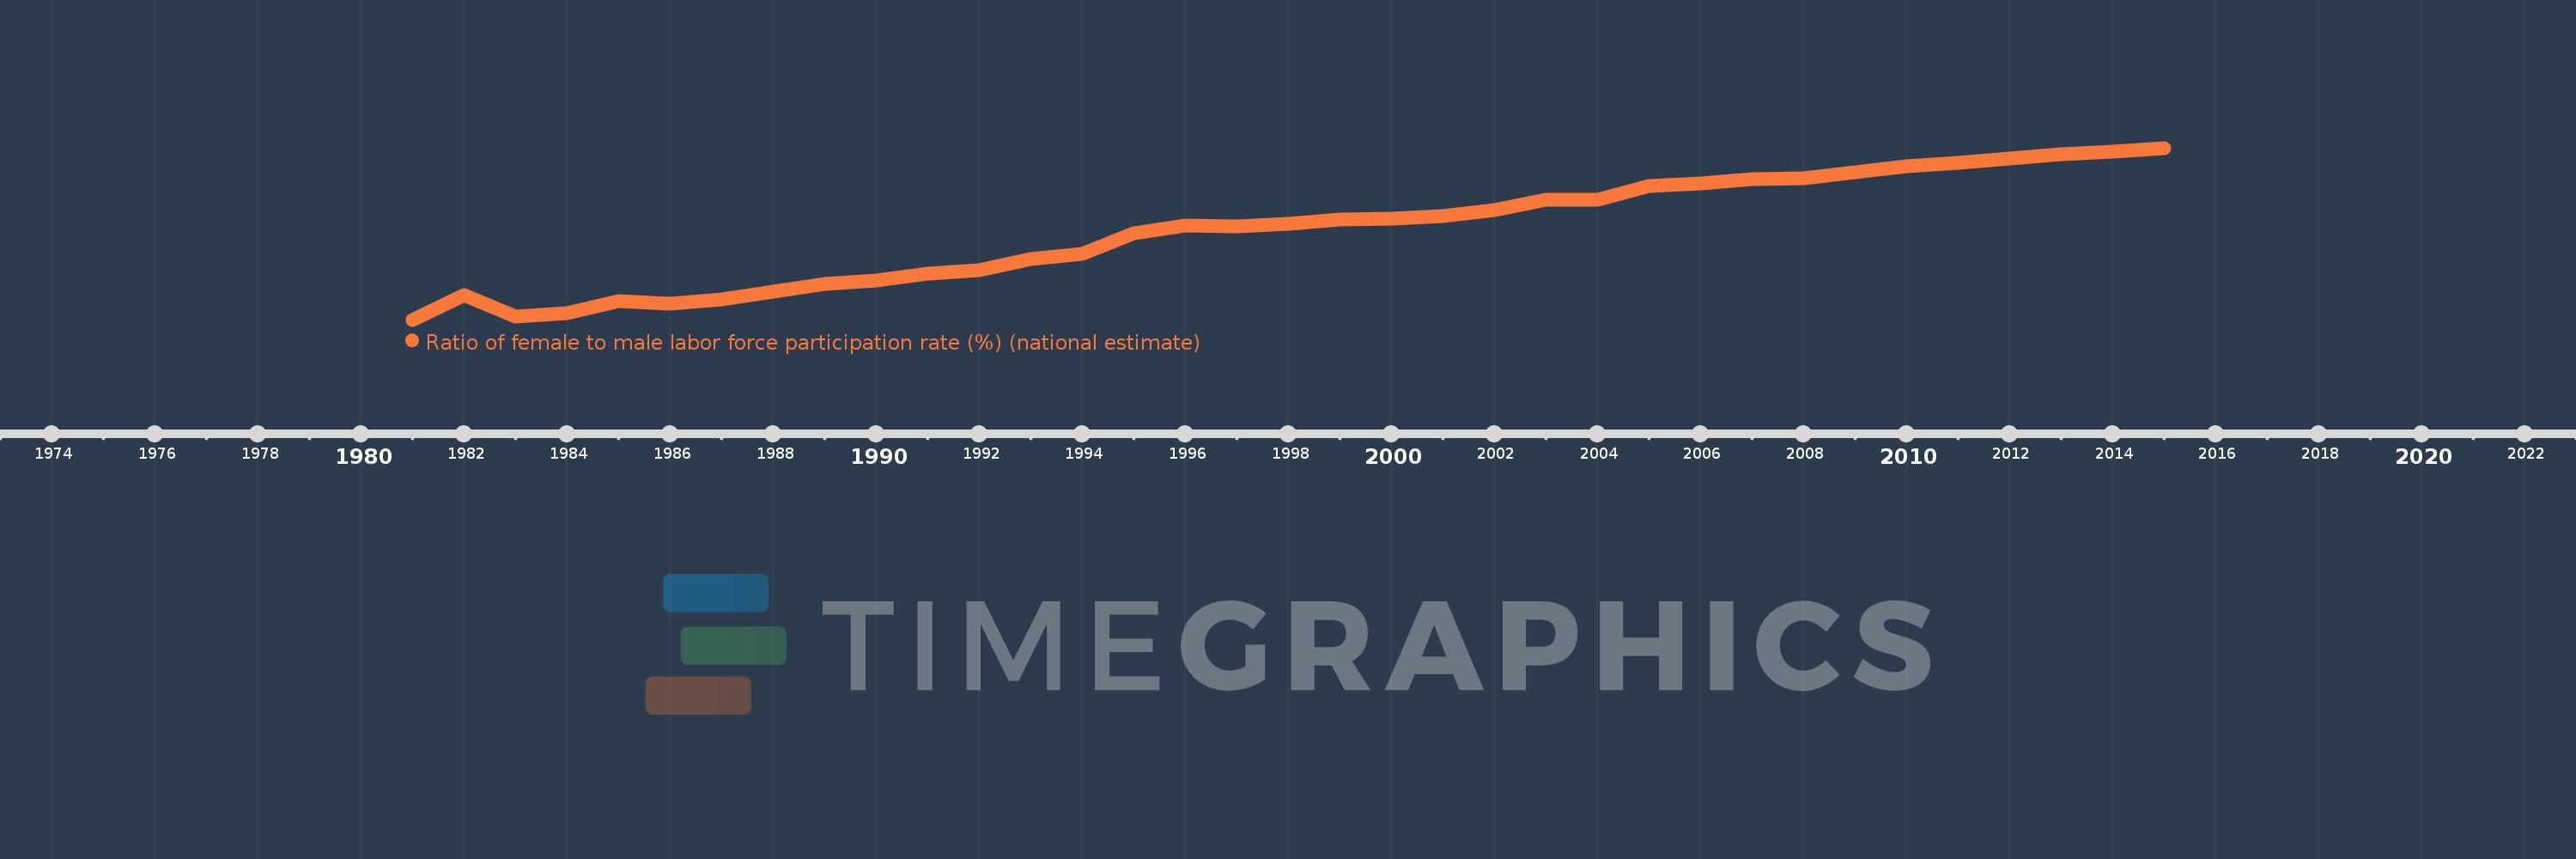
Ratio of female to male labor force participation rate (%) (national estimate)
2015,2014,2013,2012,2011,2010,2009,2008,2007,2006,2005,2004,2003,2002,2001,2000,1999,1998,1997,1996,1995,1994,1993,1992,1991,1990,1989,1988,1987,1986,1985,1984,1983,1982,1981
This statistics in other country:
AfghanistanAlbaniaAlgeriaAmerican SamoaAntigua and BarbudaArab WorldArgentinaArmeniaArubaAustraliaAustriaAzerbaijanBahamas, TheBahrainBangladeshBarbadosBelarusBelgiumBelizeBeninBermudaBhutanBoliviaBosnia and HerzegovinaBotswanaBrazilBritish Virgin IslandsBrunei DarussalamBulgariaBurkina FasoBurundiCabo VerdeCambodiaCameroonCanadaCaribbean small statesCayman IslandsCentral African RepublicCentral Europe and the BalticsChadChileColombiaComorosCongo, Dem. Rep.Congo, Rep.Costa RicaCote d'IvoireCroatiaCubaCyprusCzech RepublicDenmarkDjiboutiDominicaDominican RepublicEarly-demographic dividendEcuadorEgypt, Arab Rep.El SalvadorEquatorial GuineaEstoniaEthiopiaEuro areaEurope & Central AsiaEurope & Central Asia (excluding high income)Europe & Central Asia (IDA & IBRD countries)European UnionFaroe IslandsFijiFinlandFranceFrench PolynesiaGabonGambia, TheGeorgiaGermanyGhanaGibraltarGreeceGrenadaGuamGuatemalaGuineaGuyanaHaitiHigh incomeHondurasHong Kong SAR, ChinaHungaryIBRD onlyIcelandIDA blendIndiaIndonesiaIran, Islamic Rep.IraqIrelandIsle of ManIsraelItalyJamaicaJapanJordanKazakhstanKenyaKiribatiKorea, Rep.KosovoKuwaitKyrgyz RepublicLao PDRLatin America & Caribbean Latin America & Caribbean (excluding high income)Latin America & the Caribbean (IDA & IBRD countries)LatviaLebanonLesothoLiberiaLibyaLiechtensteinLithuaniaLower middle incomeLuxembourgMacao SAR, ChinaMacedonia, FYRMadagascarMalawiMalaysiaMaldivesMaliMaltaMarshall IslandsMauritaniaMauritiusMexicoMiddle East & North AfricaMiddle East & North Africa (excluding high income)Middle East & North Africa (IDA & IBRD countries)MoldovaMonacoMongoliaMontenegroMoroccoMozambiqueMyanmarNamibiaNauruNepalNetherlandsNew CaledoniaNew ZealandNicaraguaNigerNigeriaNorth AmericaNorthern Mariana IslandsNorwayOECD membersOmanPakistanPalauPanamaPapua New GuineaParaguayPeruPhilippinesPolandPortugalPost-demographic dividendPuerto RicoQatarRomaniaRussian FederationRwandaSamoaSan MarinoSao Tome and PrincipeSaudi ArabiaSenegalSerbiaSeychellesSierra LeoneSingaporeSlovak RepublicSloveniaSolomon IslandsSouth AfricaSouth AsiaSouth Asia (IDA & IBRD)South SudanSpainSri LankaSt. Kitts and NevisSt. LuciaSt. Vincent and the GrenadinesSudanSurinameSwazilandSwedenSwitzerlandSyrian Arab RepublicTajikistanTanzaniaThailandTimor-LesteTogoTongaTrinidad and TobagoTunisiaTurkeyTurks and Caicos IslandsTuvaluUgandaUkraineUnited Arab EmiratesUnited KingdomUnited StatesUruguayVanuatuVenezuela, RBVietnamVirgin Islands (U.S.)West Bank and GazaYemen, Rep.ZambiaZimbabwe Timeline:
This timeline shows a graph from 1981 to 2015 of Austria. No data until 1980. Number of actual observations by date: 35.
Source name:
World Development Indicators
Source organization:
International Labour Organization, Key Indicators of the Labour Market database.
Categories, topics:
Social Protection & Labor
Last updated:
apr 23, 2017
Indicators value changes by year
Minimum:
54.124
jan 1, 1981
Maximum:
83.283
jan 1, 2015
At the date of observation
Value
Absolute change
Change from previous value
jan 1, 1981
54.124
+54.124
0.0%
jan 1, 1982
58.322
+4.197
7.76%
jan 1, 1983
54.596
-3.726
-6.39%
jan 1, 1984
55.226
+0.63
1.15%
jan 1, 1985
57.264
+2.038
3.69%
jan 1, 1986
56.879
-0.384
-0.67%
jan 1, 1987
57.507
+0.628
1.1%
jan 1, 1988
58.949
+1.442
2.51%
jan 1, 1989
60.144
+1.195
2.03%
jan 1, 1990
60.75
+0.606
1.01%
jan 1, 1991
61.96
+1.209
1.99%
jan 1, 1992
62.5
+0.54
0.87%
jan 1, 1993
64.368
+1.868
2.99%
jan 1, 1994
65.368
+1.0
1.55%
jan 1, 1995
68.839
+3.471
5.31%
jan 1, 1996
70.071
+1.232
1.79%
jan 1, 1997
69.914
-0.157
-0.22%
jan 1, 1998
70.478
+0.564
0.81%
jan 1, 1999
71.14
+0.662
0.94%
jan 1, 2000
71.326
+0.186
0.26%
jan 1, 2001
71.698
+0.372
0.52%
jan 1, 2002
72.754
+1.056
1.47%
jan 1, 2003
74.449
+1.695
2.33%
jan 1, 2004
74.487
+0.037
0.05%
jan 1, 2005
76.805
+2.318
3.11%
jan 1, 2006
77.259
+0.454
0.59%
jan 1, 2007
77.961
+0.702
0.91%
jan 1, 2008
78.107
+0.145
0.19%
jan 1, 2009
79.111
+1.005
1.29%
jan 1, 2010
80.238
+1.127
1.42%
jan 1, 2011
80.775
+0.537
0.67%
jan 1, 2012
81.465
+0.69
0.85%
jan 1, 2013
82.212
+0.747
0.92%
jan 1, 2014
82.661
+0.448
0.55%
jan 1, 2015
83.283
+0.622
0.75%
Ranking of countries by current statistics by years


Comments: