30
/
AIzaSyAYiBZKx7MnpbEhh9jyipgxe19OcubqV5w
April 1, 2024
211037
Nicaragua
NIC
true
2
1
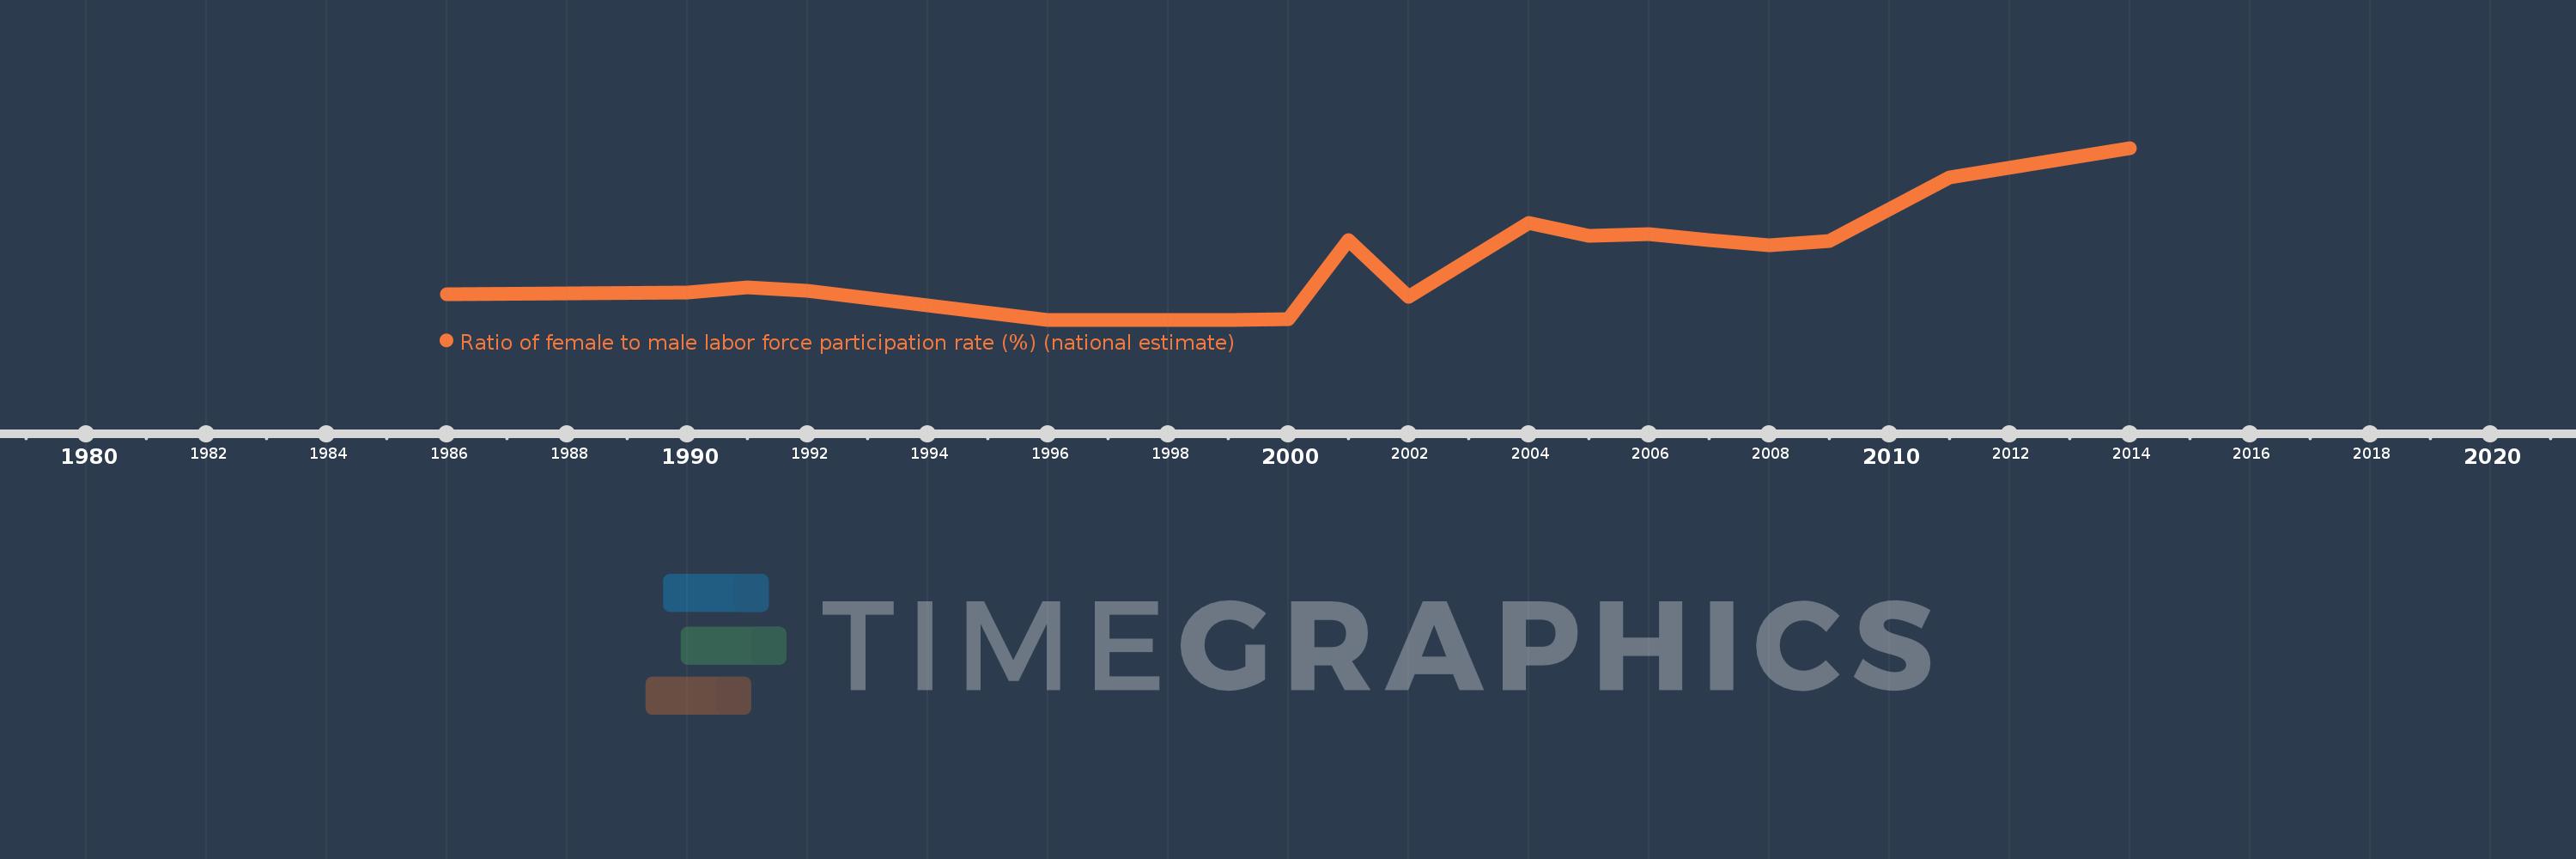
Ratio of female to male labor force participation rate (%) (national estimate)
2014,2011,2009,2008,2007,2006,2005,2004,2002,2001,2000,1999,1997,1996,1992,1991,1990,1986
