29
/
en
AIzaSyAYiBZKx7MnpbEhh9jyipgxe19OcubqV5w
April 1, 2024
160946
Israel
ISR
true
2
1
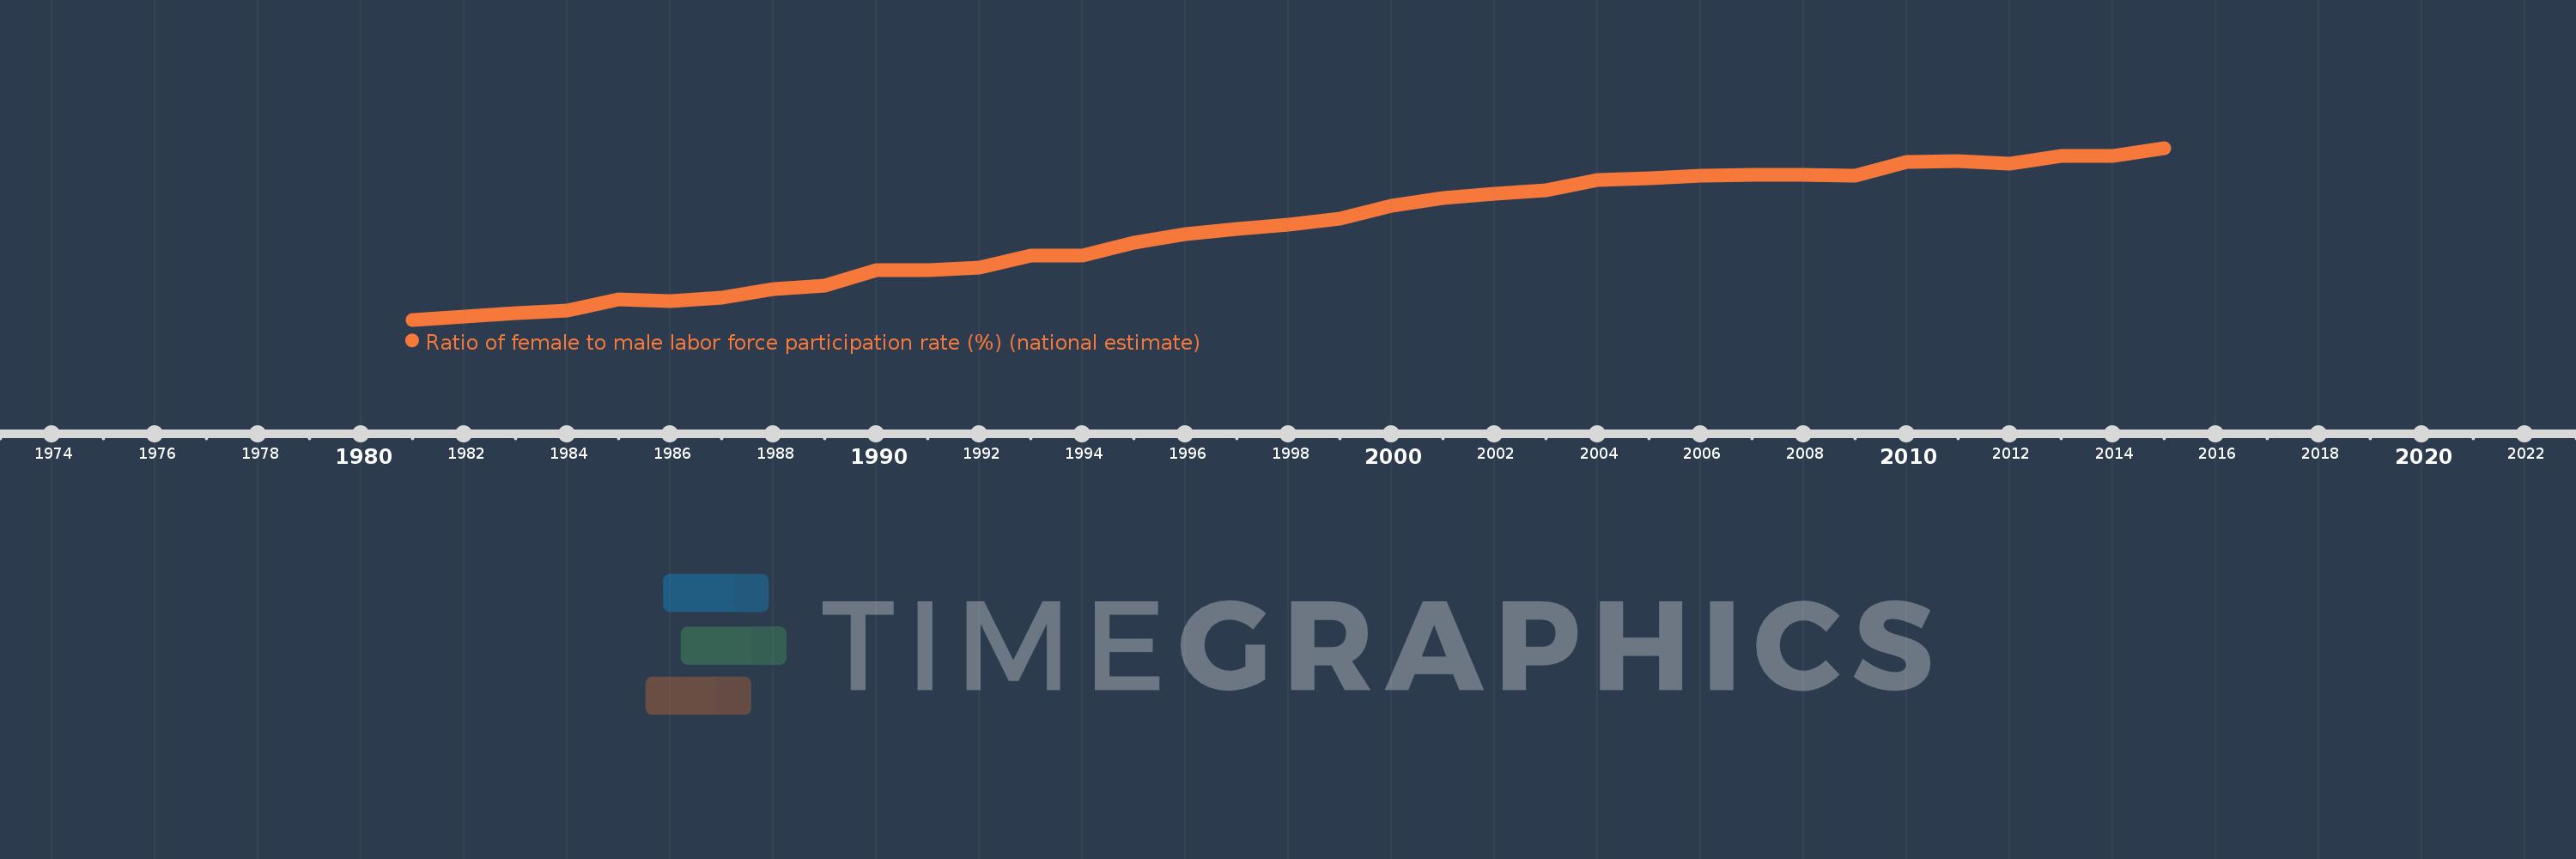
Ratio of female to male labor force participation rate (%) (national estimate)
2015,2014,2013,2012,2011,2010,2009,2008,2007,2006,2005,2004,2003,2002,2001,2000,1999,1998,1997,1996,1995,1994,1993,1992,1991,1990,1989,1988,1987,1986,1985,1984,1983,1982,1981
This statistics in other country:
AfghanistanAlbaniaAlgeriaAmerican SamoaAntigua and BarbudaArab WorldArgentinaArmeniaArubaAustraliaAustriaAzerbaijanBahamas, TheBahrainBangladeshBarbadosBelarusBelgiumBelizeBeninBermudaBhutanBoliviaBosnia and HerzegovinaBotswanaBrazilBritish Virgin IslandsBrunei DarussalamBulgariaBurkina FasoBurundiCabo VerdeCambodiaCameroonCanadaCaribbean small statesCayman IslandsCentral African RepublicCentral Europe and the BalticsChadChileColombiaComorosCongo, Dem. Rep.Congo, Rep.Costa RicaCote d'IvoireCroatiaCubaCyprusCzech RepublicDenmarkDjiboutiDominicaDominican RepublicEarly-demographic dividendEcuadorEgypt, Arab Rep.El SalvadorEquatorial GuineaEstoniaEthiopiaEuro areaEurope & Central AsiaEurope & Central Asia (excluding high income)Europe & Central Asia (IDA & IBRD countries)European UnionFaroe IslandsFijiFinlandFranceFrench PolynesiaGabonGambia, TheGeorgiaGermanyGhanaGibraltarGreeceGrenadaGuamGuatemalaGuineaGuyanaHaitiHigh incomeHondurasHong Kong SAR, ChinaHungaryIBRD onlyIcelandIDA blendIndiaIndonesiaIran, Islamic Rep.IraqIrelandIsle of ManIsraelItalyJamaicaJapanJordanKazakhstanKenyaKiribatiKorea, Rep.KosovoKuwaitKyrgyz RepublicLao PDRLatin America & Caribbean Latin America & Caribbean (excluding high income)Latin America & the Caribbean (IDA & IBRD countries)LatviaLebanonLesothoLiberiaLibyaLiechtensteinLithuaniaLower middle incomeLuxembourgMacao SAR, ChinaMacedonia, FYRMadagascarMalawiMalaysiaMaldivesMaliMaltaMarshall IslandsMauritaniaMauritiusMexicoMiddle East & North AfricaMiddle East & North Africa (excluding high income)Middle East & North Africa (IDA & IBRD countries)MoldovaMonacoMongoliaMontenegroMoroccoMozambiqueMyanmarNamibiaNauruNepalNetherlandsNew CaledoniaNew ZealandNicaraguaNigerNigeriaNorth AmericaNorthern Mariana IslandsNorwayOECD membersOmanPakistanPalauPanamaPapua New GuineaParaguayPeruPhilippinesPolandPortugalPost-demographic dividendPuerto RicoQatarRomaniaRussian FederationRwandaSamoaSan MarinoSao Tome and PrincipeSaudi ArabiaSenegalSerbiaSeychellesSierra LeoneSingaporeSlovak RepublicSloveniaSolomon IslandsSouth AfricaSouth AsiaSouth Asia (IDA & IBRD)South SudanSpainSri LankaSt. Kitts and NevisSt. LuciaSt. Vincent and the GrenadinesSudanSurinameSwazilandSwedenSwitzerlandSyrian Arab RepublicTajikistanTanzaniaThailandTimor-LesteTogoTongaTrinidad and TobagoTunisiaTurkeyTurks and Caicos IslandsTuvaluUgandaUkraineUnited Arab EmiratesUnited KingdomUnited StatesUruguayVanuatuVenezuela, RBVietnamVirgin Islands (U.S.)West Bank and GazaYemen, Rep.ZambiaZimbabwe Timeline:
This timeline shows a graph from 1981 to 2015 of Israel. No data until 1980. Number of actual observations by date: 35.
Source name:
World Development Indicators
Source organization:
International Labour Organization, Key Indicators of the Labour Market database.
Categories, topics:
Social Protection & Labor
Last updated:
apr 23, 2017
Indicators value changes by year
Minimum:
56.044
jan 1, 1981
At the date of observation
Value
Absolute change
Change from previous value
jan 1, 1981
56.044
+56.044
0.0%
jan 1, 1982
56.583
+0.539
0.96%
jan 1, 1983
57.098
+0.515
0.91%
jan 1, 1984
57.638
+0.54
0.95%
jan 1, 1985
59.494
+1.856
3.22%
jan 1, 1986
59.218
-0.276
-0.46%
jan 1, 1987
59.804
+0.586
0.99%
jan 1, 1988
61.281
+1.477
2.47%
jan 1, 1989
61.801
+0.519
0.85%
jan 1, 1990
64.423
+2.622
4.24%
jan 1, 1991
64.485
+0.062
0.1%
jan 1, 1992
64.951
+0.467
0.72%
jan 1, 1993
66.993
+2.042
3.14%
jan 1, 1994
66.985
-0.008
-0.01%
jan 1, 1995
69.168
+2.183
3.26%
jan 1, 1996
70.588
+1.42
2.05%
jan 1, 1997
71.389
+0.801
1.13%
jan 1, 1998
72.191
+0.802
1.12%
jan 1, 1999
73.181
+0.99
1.37%
jan 1, 2000
75.431
+2.25
3.07%
jan 1, 2001
76.758
+1.326
1.76%
jan 1, 2002
77.378
+0.62
0.81%
jan 1, 2003
78.038
+0.661
0.85%
jan 1, 2004
79.706
+1.668
2.14%
jan 1, 2005
79.971
+0.265
0.33%
jan 1, 2006
80.495
+0.524
0.66%
jan 1, 2007
80.608
+0.113
0.14%
jan 1, 2008
80.631
+0.023
0.03%
jan 1, 2009
80.516
-0.116
-0.14%
jan 1, 2010
82.874
+2.358
2.93%
jan 1, 2011
82.973
+0.099
0.12%
jan 1, 2012
82.514
-0.458
-0.55%
jan 1, 2013
83.838
+1.324
1.6%
jan 1, 2014
83.862
+0.023
0.03%
jan 1, 2015
85.18
+1.318
1.57%
Ranking of countries by current statistics by years


Comments: