29
/
en
AIzaSyAYiBZKx7MnpbEhh9jyipgxe19OcubqV5w
April 1, 2024
133577
Finland
FIN
true
2
1
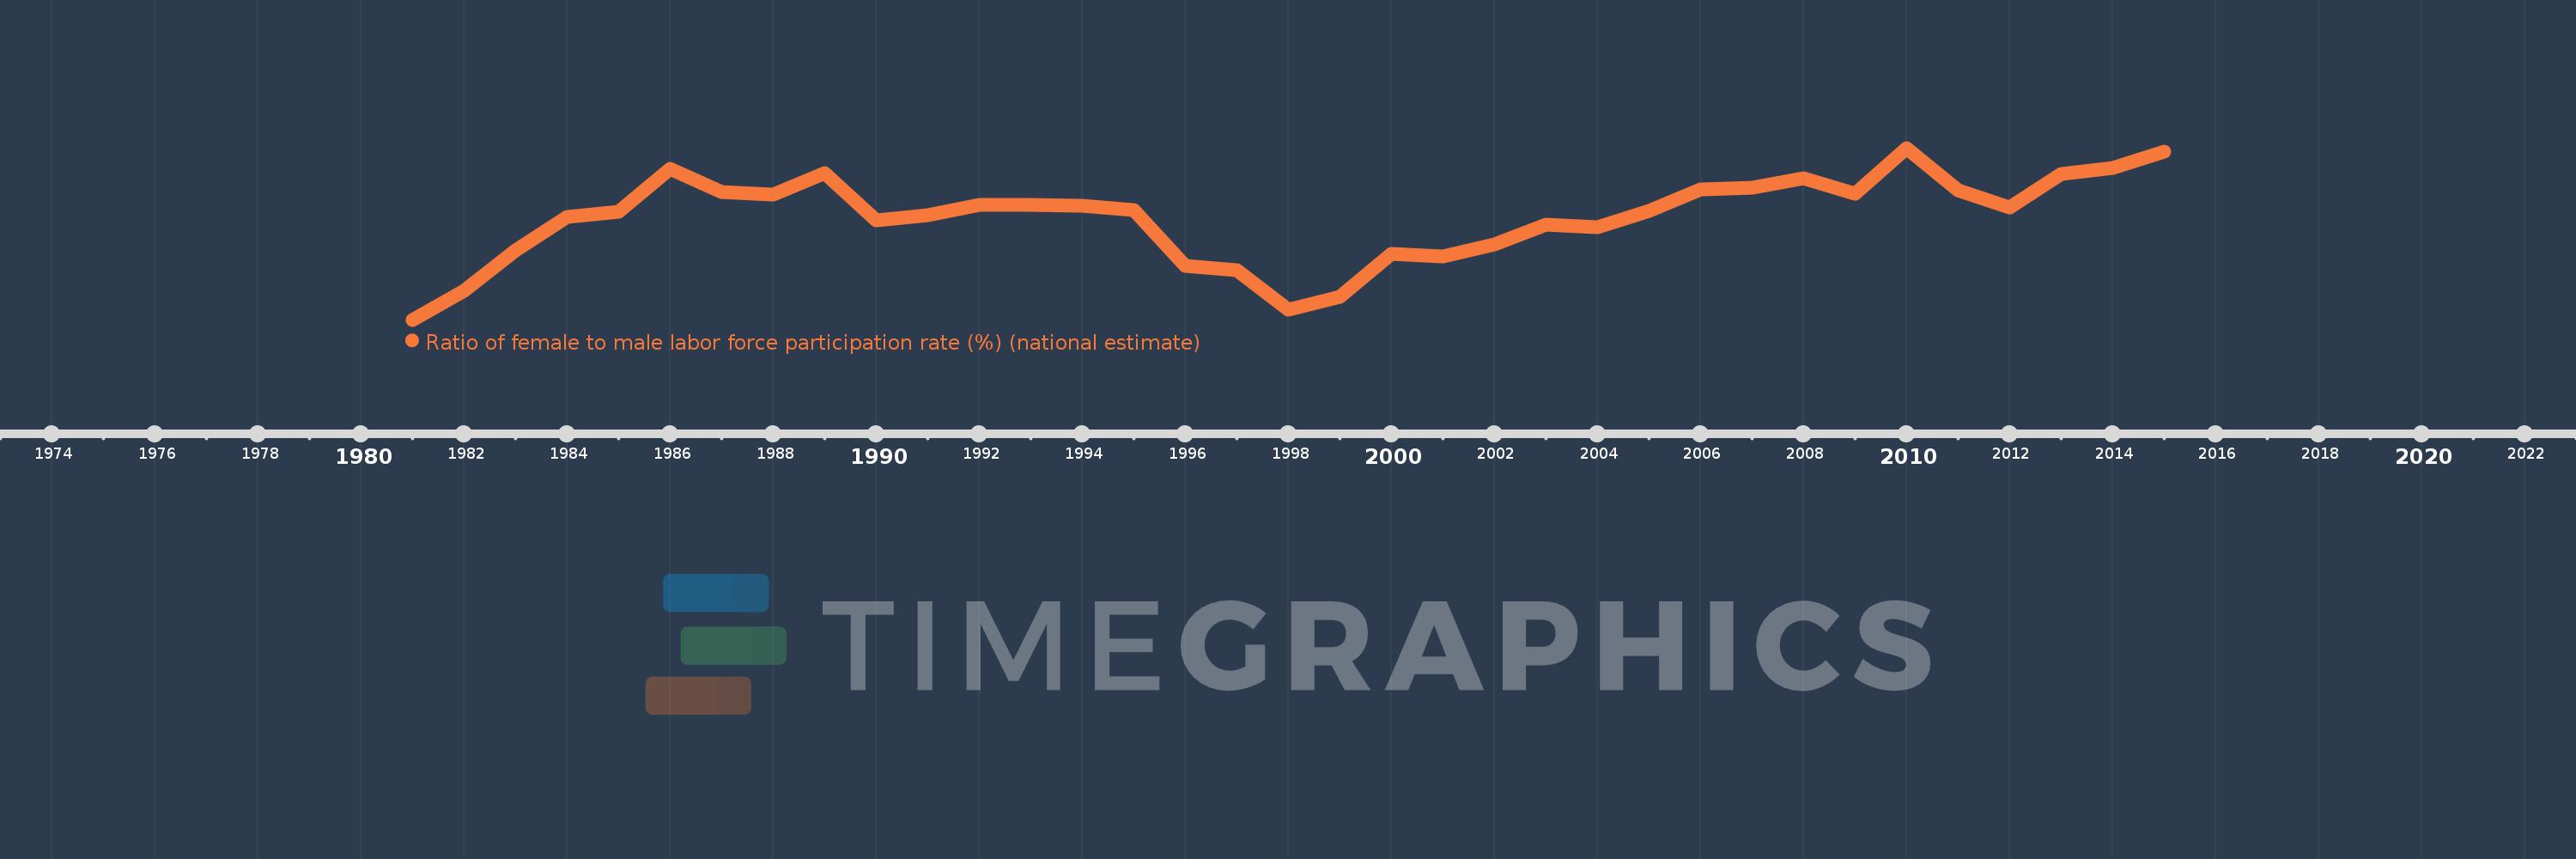
Ratio of female to male labor force participation rate (%) (national estimate)
2015,2014,2013,2012,2011,2010,2009,2008,2007,2006,2005,2004,2003,2002,2001,2000,1999,1998,1997,1996,1995,1994,1993,1992,1991,1990,1989,1988,1987,1986,1985,1984,1983,1982,1981
This statistics in other country:
AfghanistanAlbaniaAlgeriaAmerican SamoaAntigua and BarbudaArab WorldArgentinaArmeniaArubaAustraliaAustriaAzerbaijanBahamas, TheBahrainBangladeshBarbadosBelarusBelgiumBelizeBeninBermudaBhutanBoliviaBosnia and HerzegovinaBotswanaBrazilBritish Virgin IslandsBrunei DarussalamBulgariaBurkina FasoBurundiCabo VerdeCambodiaCameroonCanadaCaribbean small statesCayman IslandsCentral African RepublicCentral Europe and the BalticsChadChileColombiaComorosCongo, Dem. Rep.Congo, Rep.Costa RicaCote d'IvoireCroatiaCubaCyprusCzech RepublicDenmarkDjiboutiDominicaDominican RepublicEarly-demographic dividendEcuadorEgypt, Arab Rep.El SalvadorEquatorial GuineaEstoniaEthiopiaEuro areaEurope & Central AsiaEurope & Central Asia (excluding high income)Europe & Central Asia (IDA & IBRD countries)European UnionFaroe IslandsFijiFinlandFranceFrench PolynesiaGabonGambia, TheGeorgiaGermanyGhanaGibraltarGreeceGrenadaGuamGuatemalaGuineaGuyanaHaitiHigh incomeHondurasHong Kong SAR, ChinaHungaryIBRD onlyIcelandIDA blendIndiaIndonesiaIran, Islamic Rep.IraqIrelandIsle of ManIsraelItalyJamaicaJapanJordanKazakhstanKenyaKiribatiKorea, Rep.KosovoKuwaitKyrgyz RepublicLao PDRLatin America & Caribbean Latin America & Caribbean (excluding high income)Latin America & the Caribbean (IDA & IBRD countries)LatviaLebanonLesothoLiberiaLibyaLiechtensteinLithuaniaLower middle incomeLuxembourgMacao SAR, ChinaMacedonia, FYRMadagascarMalawiMalaysiaMaldivesMaliMaltaMarshall IslandsMauritaniaMauritiusMexicoMiddle East & North AfricaMiddle East & North Africa (excluding high income)Middle East & North Africa (IDA & IBRD countries)MoldovaMonacoMongoliaMontenegroMoroccoMozambiqueMyanmarNamibiaNauruNepalNetherlandsNew CaledoniaNew ZealandNicaraguaNigerNigeriaNorth AmericaNorthern Mariana IslandsNorwayOECD membersOmanPakistanPalauPanamaPapua New GuineaParaguayPeruPhilippinesPolandPortugalPost-demographic dividendPuerto RicoQatarRomaniaRussian FederationRwandaSamoaSan MarinoSao Tome and PrincipeSaudi ArabiaSenegalSerbiaSeychellesSierra LeoneSingaporeSlovak RepublicSloveniaSolomon IslandsSouth AfricaSouth AsiaSouth Asia (IDA & IBRD)South SudanSpainSri LankaSt. Kitts and NevisSt. LuciaSt. Vincent and the GrenadinesSudanSurinameSwazilandSwedenSwitzerlandSyrian Arab RepublicTajikistanTanzaniaThailandTimor-LesteTogoTongaTrinidad and TobagoTunisiaTurkeyTurks and Caicos IslandsTuvaluUgandaUkraineUnited Arab EmiratesUnited KingdomUnited StatesUruguayVanuatuVenezuela, RBVietnamVirgin Islands (U.S.)West Bank and GazaYemen, Rep.ZambiaZimbabwe Timeline:
This timeline shows a graph from 1981 to 2015 of Finland. No data until 1980. Number of actual observations by date: 35.
Source name:
World Development Indicators
Source organization:
International Labour Organization, Key Indicators of the Labour Market database.
Categories, topics:
Social Protection & Labor
Last updated:
apr 23, 2017
Indicators value changes by year
Minimum:
82.973
jan 1, 1981
Maximum:
88.785
jan 1, 2010
At the date of observation
Value
Absolute change
Change from previous value
jan 1, 1981
82.973
+82.973
0.0%
jan 1, 1982
83.962
+0.989
1.19%
jan 1, 1983
85.31
+1.348
1.61%
jan 1, 1984
86.45
+1.14
1.34%
jan 1, 1985
86.622
+0.172
0.2%
jan 1, 1986
88.076
+1.454
1.68%
jan 1, 1987
87.297
-0.779
-0.88%
jan 1, 1988
87.193
-0.104
-0.12%
jan 1, 1989
87.929
+0.735
0.84%
jan 1, 1990
86.34
-1.589
-1.81%
jan 1, 1991
86.515
+0.176
0.2%
jan 1, 1992
86.867
+0.352
0.41%
jan 1, 1993
86.853
-0.014
-0.02%
jan 1, 1994
86.827
-0.026
-0.03%
jan 1, 1995
86.676
-0.151
-0.17%
jan 1, 1996
84.789
-1.887
-2.18%
jan 1, 1997
84.651
-0.138
-0.16%
jan 1, 1998
83.308
-1.343
-1.59%
jan 1, 1999
83.739
+0.431
0.52%
jan 1, 2000
85.191
+1.452
1.73%
jan 1, 2001
85.109
-0.081
-0.1%
jan 1, 2002
85.526
+0.417
0.49%
jan 1, 2003
86.197
+0.67
0.78%
jan 1, 2004
86.115
-0.082
-0.09%
jan 1, 2005
86.657
+0.541
0.63%
jan 1, 2006
87.385
+0.728
0.84%
jan 1, 2007
87.443
+0.058
0.07%
jan 1, 2008
87.768
+0.325
0.37%
jan 1, 2009
87.234
-0.534
-0.61%
jan 1, 2010
88.785
+1.551
1.78%
jan 1, 2011
87.363
-1.422
-1.6%
jan 1, 2012
86.781
-0.583
-0.67%
jan 1, 2013
87.912
+1.131
1.3%
jan 1, 2014
88.095
+0.183
0.21%
jan 1, 2015
88.658
+0.563
0.64%
Ranking of countries by current statistics by years


Comments: