29
/
en
AIzaSyAYiBZKx7MnpbEhh9jyipgxe19OcubqV5w
April 1, 2024
70590
Argentina
ARG
true
2
1
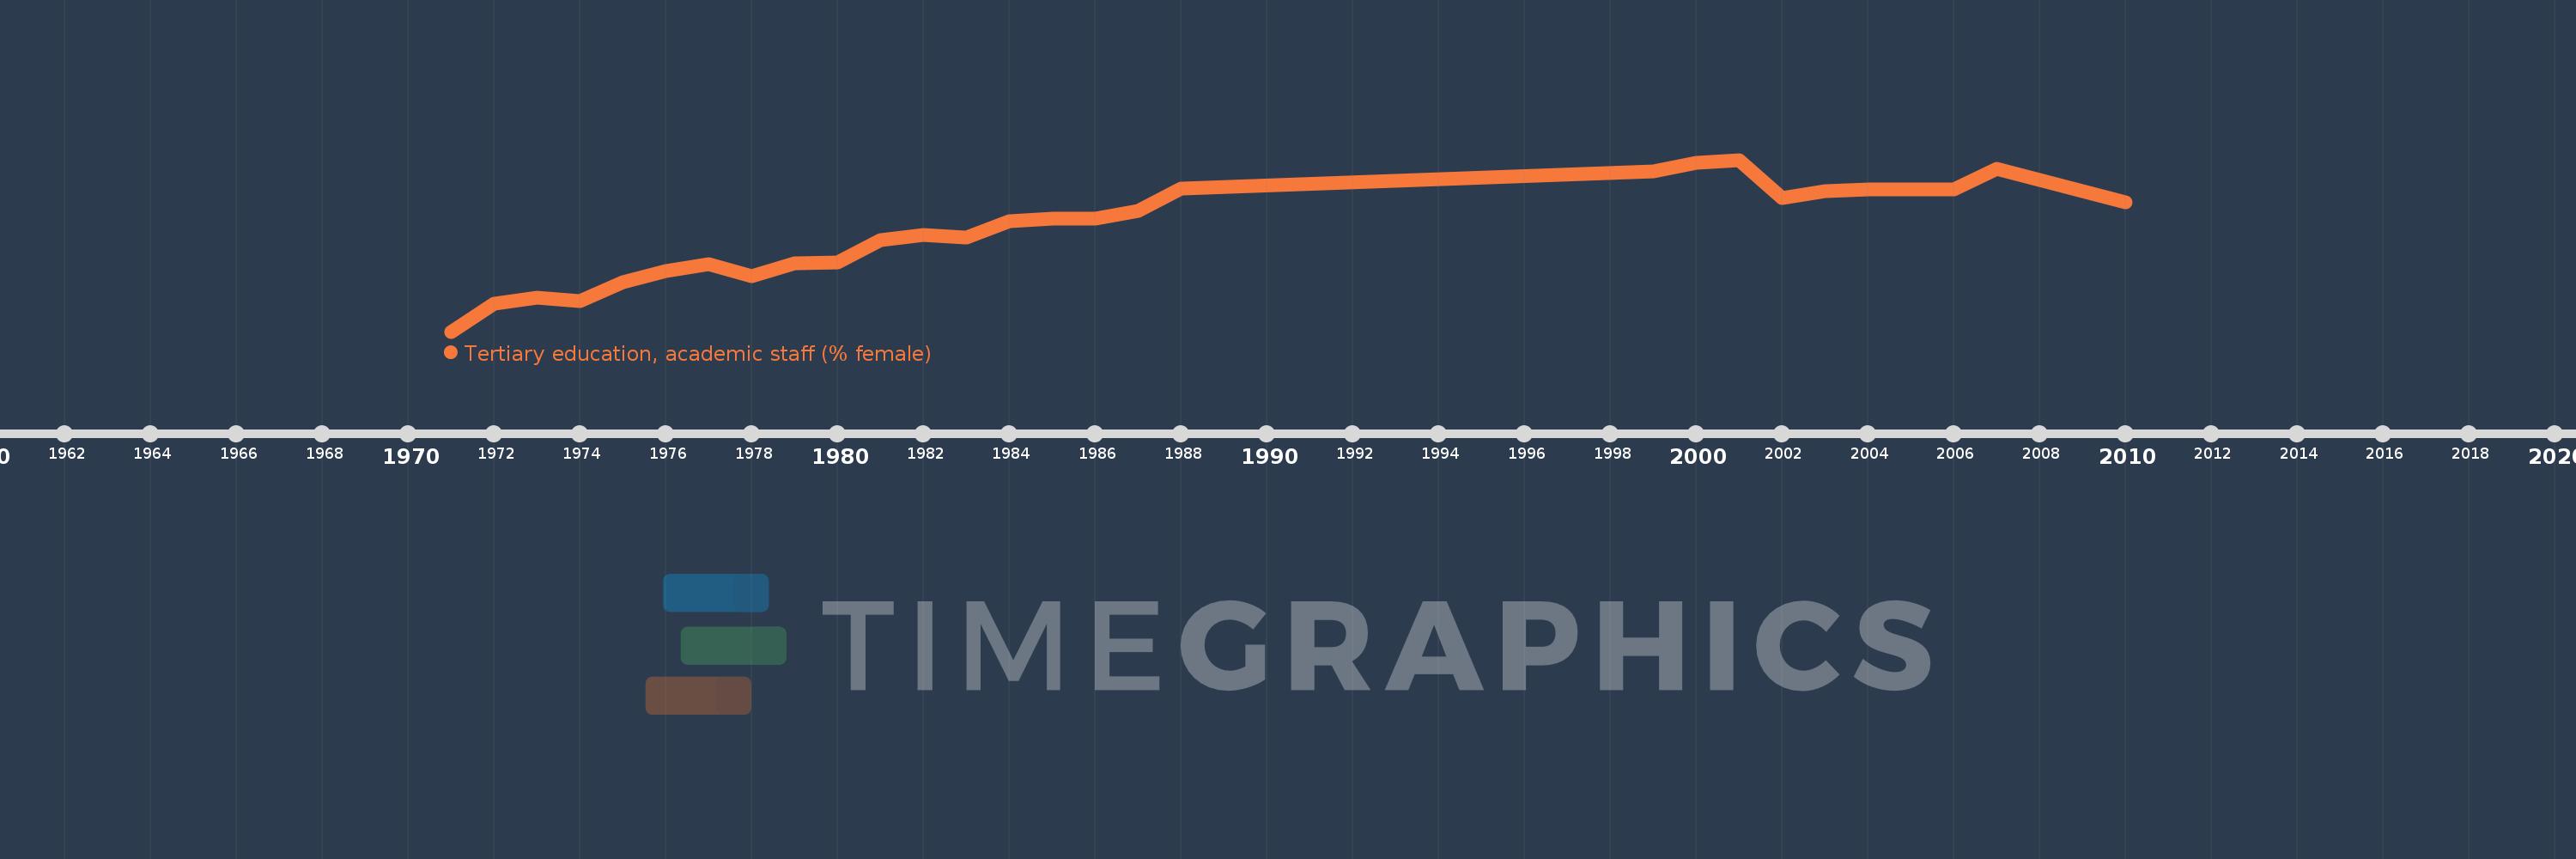
Tertiary education, academic staff (% female)
2010,2007,2006,2005,2004,2003,2002,2001,2000,1999,1988,1987,1986,1985,1984,1983,1982,1981,1980,1979,1978,1977,1976,1975,1974,1973,1972,1971
This statistics in other country:
AfghanistanAlbaniaAlgeriaAndorraAngolaAntigua and BarbudaArab WorldArgentinaArmeniaArubaAustraliaAustriaAzerbaijanBahamas, TheBahrainBangladeshBarbadosBelarusBelgiumBelizeBeninBermudaBhutanBoliviaBosnia and HerzegovinaBotswanaBrazilBritish Virgin IslandsBrunei DarussalamBulgariaBurkina FasoBurundiCabo VerdeCambodiaCameroonCanadaCaribbean small statesCayman IslandsCentral African RepublicCentral Europe and the BalticsChadChileChinaColombiaComorosCongo, Dem. Rep.Congo, Rep.Costa RicaCote d'IvoireCroatiaCubaCyprusCzech RepublicDenmarkDjiboutiDominicaDominican RepublicEarly-demographic dividendEast Asia & PacificEast Asia & Pacific (excluding high income)East Asia & Pacific (IDA & IBRD countries)EcuadorEgypt, Arab Rep.El SalvadorEquatorial GuineaEritreaEstoniaEthiopiaEuro areaEurope & Central AsiaEurope & Central Asia (excluding high income)Europe & Central Asia (IDA & IBRD countries)European UnionFijiFinlandFragile and conflict affected situationsFranceGabonGambia, TheGeorgiaGermanyGhanaGreeceGrenadaGuineaGuyanaHaitiHeavily indebted poor countries (HIPC)High incomeHondurasHong Kong SAR, ChinaHungaryIBRD onlyIcelandIDA & IBRD totalIDA blendIDA onlyIDA totalIndiaIndonesiaIran, Islamic Rep.IraqIrelandItalyJamaicaJapanJordanKazakhstanKorea, Dem. People’s Rep.Korea, Rep.KuwaitKyrgyz RepublicLao PDRLate-demographic dividendLatin America & Caribbean Latin America & Caribbean (excluding high income)Latin America & the Caribbean (IDA & IBRD countries)LatviaLeast developed countries: UN classificationLebanonLesothoLiberiaLibyaLiechtensteinLithuaniaLow & middle incomeLow incomeLower middle incomeLuxembourgMacao SAR, ChinaMacedonia, FYRMadagascarMalawiMalaysiaMaldivesMaliMaltaMarshall IslandsMauritaniaMauritiusMicronesia, Fed. Sts.Middle East & North AfricaMiddle East & North Africa (excluding high income)Middle East & North Africa (IDA & IBRD countries)Middle incomeMoldovaMongoliaMoroccoMozambiqueMyanmarNamibiaNepalNetherlandsNew ZealandNicaraguaNigerNigeriaNorth AmericaNorwayOECD membersOmanOther small statesPacific island small statesPakistanPalauPanamaPapua New GuineaPeruPhilippinesPolandPortugalPost-demographic dividendPre-demographic dividendPuerto RicoQatarRomaniaRussian FederationRwandaSamoaSao Tome and PrincipeSaudi ArabiaSenegalSerbiaSeychellesSierra LeoneSingaporeSint Maarten (Dutch part)Slovak RepublicSloveniaSmall statesSomaliaSouth AfricaSouth AsiaSouth Asia (IDA & IBRD)SpainSri LankaSt. Kitts and NevisSt. LuciaSt. Vincent and the GrenadinesSub-Saharan Africa Sub-Saharan Africa (excluding high income)Sub-Saharan Africa (IDA & IBRD countries)SudanSurinameSwazilandSwedenSwitzerlandSyrian Arab RepublicTajikistanTanzaniaThailandTimor-LesteTogoTongaTrinidad and TobagoTunisiaTurkeyTurkmenistanUgandaUnited Arab EmiratesUnited KingdomUnited StatesUpper middle incomeUruguayUzbekistanVenezuela, RBVietnamWest Bank and GazaWorldYemen, Rep.Zimbabwe Timeline:
This timeline shows a graph from 1971 to 2010 of Argentina. No data until 1970. Number of actual observations by date: 28.
Source name:
World Development Indicators
Source organization:
United Nations Educational, Scientific, and Cultural Organization (UNESCO) Institute for Statistics.
Categories, topics:
Education
Last updated:
apr 23, 2017
Indicators value changes by year
Minimum:
30.649
jan 1, 1971
Maximum:
54.404
jan 1, 2001
At the date of observation
Value
Absolute change
Change from previous value
jan 1, 1971
30.649
+30.649
0.0%
jan 1, 1972
34.537
+3.888
12.69%
jan 1, 1973
35.301
+0.764
2.21%
jan 1, 1974
34.922
-0.379
-1.07%
jan 1, 1975
37.445
+2.523
7.23%
jan 1, 1976
39.078
+1.633
4.36%
jan 1, 1977
40.006
+0.927
2.37%
jan 1, 1978
38.285
-1.721
-4.3%
jan 1, 1979
40.064
+1.779
4.65%
jan 1, 1980
40.25
+0.186
0.46%
jan 1, 1981
43.312
+3.061
7.61%
jan 1, 1982
43.981
+0.669
1.54%
jan 1, 1983
43.626
-0.355
-0.81%
jan 1, 1984
45.87
+2.244
5.14%
jan 1, 1985
46.263
+0.393
0.86%
jan 1, 1986
46.244
-0.019
-0.04%
jan 1, 1987
47.297
+1.053
2.28%
jan 1, 1988
50.474
+3.177
6.72%
jan 1, 1999
52.768
+2.294
4.54%
jan 1, 2000
53.979
+1.211
2.29%
jan 1, 2001
54.404
+0.426
0.79%
jan 1, 2002
49.103
-5.302
-9.74%
jan 1, 2003
50.126
+1.024
2.08%
jan 1, 2004
50.25
+0.124
0.25%
jan 1, 2005
50.363
+0.112
0.22%
jan 1, 2006
50.362
0.0
0.0%
jan 1, 2007
53.153
+2.791
5.54%
jan 1, 2010
48.564
-4.589
-8.63%
Ranking of countries by current statistics by years


Comments: