29
/
en
AIzaSyAYiBZKx7MnpbEhh9jyipgxe19OcubqV5w
April 1, 2024
248119
Spain
ESP
true
2
1
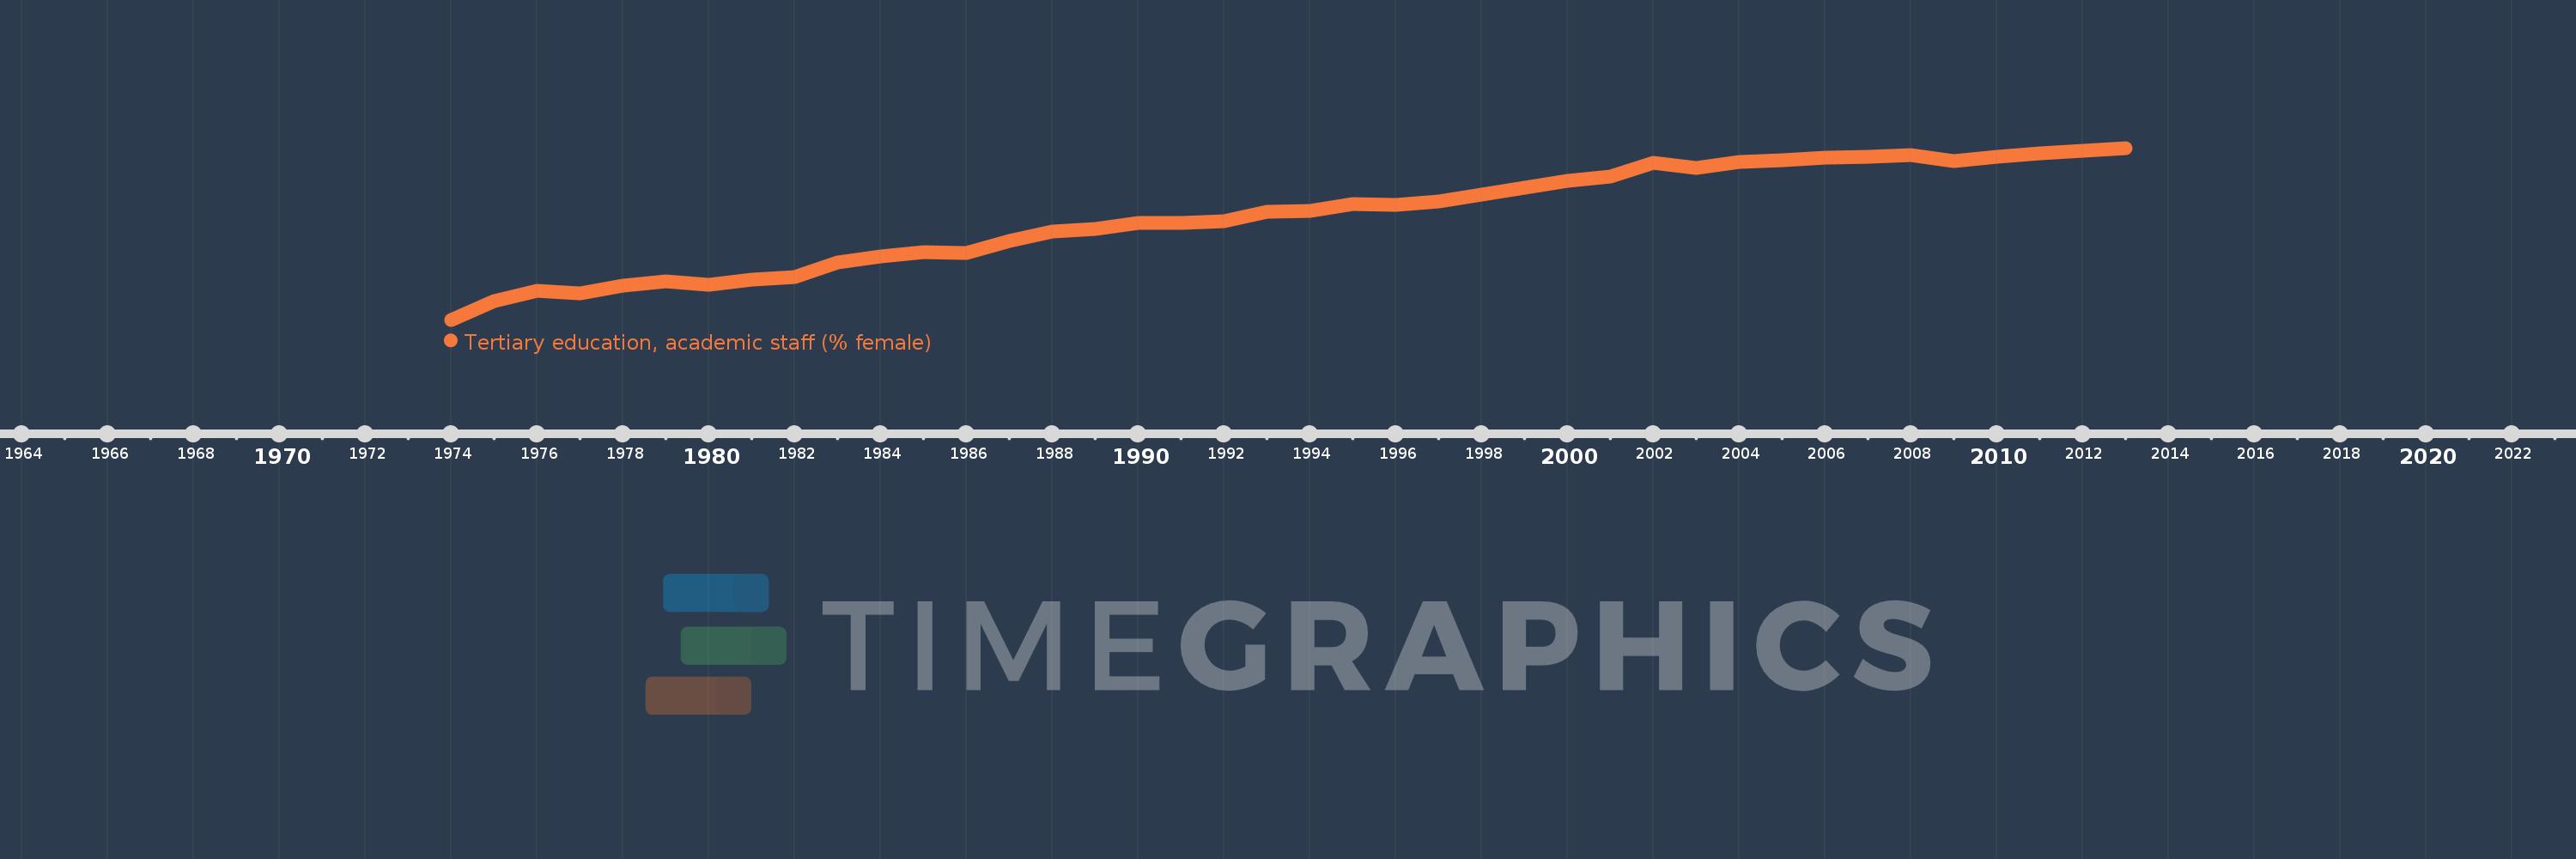
Tertiary education, academic staff (% female)
2013,2012,2011,2010,2009,2008,2007,2006,2005,2004,2003,2002,2001,2000,1997,1996,1995,1994,1993,1992,1991,1990,1989,1988,1987,1986,1985,1984,1983,1982,1981,1980,1979,1978,1977,1976,1975,1974
This statistics in other country:
AfghanistanAlbaniaAlgeriaAndorraAngolaAntigua and BarbudaArab WorldArgentinaArmeniaArubaAustraliaAustriaAzerbaijanBahamas, TheBahrainBangladeshBarbadosBelarusBelgiumBelizeBeninBermudaBhutanBoliviaBosnia and HerzegovinaBotswanaBrazilBritish Virgin IslandsBrunei DarussalamBulgariaBurkina FasoBurundiCabo VerdeCambodiaCameroonCanadaCaribbean small statesCayman IslandsCentral African RepublicCentral Europe and the BalticsChadChileChinaColombiaComorosCongo, Dem. Rep.Congo, Rep.Costa RicaCote d'IvoireCroatiaCubaCyprusCzech RepublicDenmarkDjiboutiDominicaDominican RepublicEarly-demographic dividendEast Asia & PacificEast Asia & Pacific (excluding high income)East Asia & Pacific (IDA & IBRD countries)EcuadorEgypt, Arab Rep.El SalvadorEquatorial GuineaEritreaEstoniaEthiopiaEuro areaEurope & Central AsiaEurope & Central Asia (excluding high income)Europe & Central Asia (IDA & IBRD countries)European UnionFijiFinlandFragile and conflict affected situationsFranceGabonGambia, TheGeorgiaGermanyGhanaGreeceGrenadaGuineaGuyanaHaitiHeavily indebted poor countries (HIPC)High incomeHondurasHong Kong SAR, ChinaHungaryIBRD onlyIcelandIDA & IBRD totalIDA blendIDA onlyIDA totalIndiaIndonesiaIran, Islamic Rep.IraqIrelandItalyJamaicaJapanJordanKazakhstanKorea, Dem. People’s Rep.Korea, Rep.KuwaitKyrgyz RepublicLao PDRLate-demographic dividendLatin America & Caribbean Latin America & Caribbean (excluding high income)Latin America & the Caribbean (IDA & IBRD countries)LatviaLeast developed countries: UN classificationLebanonLesothoLiberiaLibyaLiechtensteinLithuaniaLow & middle incomeLow incomeLower middle incomeLuxembourgMacao SAR, ChinaMacedonia, FYRMadagascarMalawiMalaysiaMaldivesMaliMaltaMarshall IslandsMauritaniaMauritiusMicronesia, Fed. Sts.Middle East & North AfricaMiddle East & North Africa (excluding high income)Middle East & North Africa (IDA & IBRD countries)Middle incomeMoldovaMongoliaMoroccoMozambiqueMyanmarNamibiaNepalNetherlandsNew ZealandNicaraguaNigerNigeriaNorth AmericaNorwayOECD membersOmanOther small statesPacific island small statesPakistanPalauPanamaPapua New GuineaPeruPhilippinesPolandPortugalPost-demographic dividendPre-demographic dividendPuerto RicoQatarRomaniaRussian FederationRwandaSamoaSao Tome and PrincipeSaudi ArabiaSenegalSerbiaSeychellesSierra LeoneSingaporeSint Maarten (Dutch part)Slovak RepublicSloveniaSmall statesSomaliaSouth AfricaSouth AsiaSouth Asia (IDA & IBRD)SpainSri LankaSt. Kitts and NevisSt. LuciaSt. Vincent and the GrenadinesSub-Saharan Africa Sub-Saharan Africa (excluding high income)Sub-Saharan Africa (IDA & IBRD countries)SudanSurinameSwazilandSwedenSwitzerlandSyrian Arab RepublicTajikistanTanzaniaThailandTimor-LesteTogoTongaTrinidad and TobagoTunisiaTurkeyTurkmenistanUgandaUnited Arab EmiratesUnited KingdomUnited StatesUpper middle incomeUruguayUzbekistanVenezuela, RBVietnamWest Bank and GazaWorldYemen, Rep.Zimbabwe Timeline:
This timeline shows a graph from 1974 to 2013 of Spain. No data until 1973. Number of actual observations by date: 38.
Source name:
World Development Indicators
Source organization:
United Nations Educational, Scientific, and Cultural Organization (UNESCO) Institute for Statistics.
Categories, topics:
Education
Last updated:
apr 23, 2017
Indicators value changes by year
Minimum:
14.715
jan 1, 1974
Maximum:
40.204
jan 1, 2013
At the date of observation
Value
Absolute change
Change from previous value
jan 1, 1974
14.715
+14.715
0.0%
jan 1, 1975
17.439
+2.724
18.51%
jan 1, 1976
18.987
+1.548
8.88%
jan 1, 1977
18.646
-0.341
-1.79%
jan 1, 1978
19.724
+1.079
5.78%
jan 1, 1979
20.385
+0.66
3.35%
jan 1, 1980
19.878
-0.506
-2.48%
jan 1, 1981
20.658
+0.78
3.92%
jan 1, 1982
21.006
+0.347
1.68%
jan 1, 1983
23.248
+2.242
10.67%
jan 1, 1984
24.065
+0.817
3.52%
jan 1, 1985
24.699
+0.634
2.63%
jan 1, 1986
24.63
-0.069
-0.28%
jan 1, 1987
26.423
+1.793
7.28%
jan 1, 1988
27.857
+1.434
5.43%
jan 1, 1989
28.213
+0.356
1.28%
jan 1, 1990
29.081
+0.868
3.08%
jan 1, 1991
29.033
-0.047
-0.16%
jan 1, 1992
29.387
+0.354
1.22%
jan 1, 1993
30.72
+1.333
4.54%
jan 1, 1994
30.822
+0.102
0.33%
jan 1, 1995
31.889
+1.067
3.46%
jan 1, 1996
31.708
-0.181
-0.57%
jan 1, 1997
32.32
+0.612
1.93%
jan 1, 2000
35.289
+2.969
9.19%
jan 1, 2001
36.001
+0.712
2.02%
jan 1, 2002
37.991
+1.989
5.53%
jan 1, 2003
37.205
-0.786
-2.07%
jan 1, 2004
38.104
+0.899
2.42%
jan 1, 2005
38.352
+0.247
0.65%
jan 1, 2006
38.817
+0.465
1.21%
jan 1, 2007
38.899
+0.082
0.21%
jan 1, 2008
39.138
+0.239
0.61%
jan 1, 2009
38.197
-0.941
-2.4%
jan 1, 2010
38.869
+0.671
1.76%
jan 1, 2011
39.453
+0.585
1.5%
jan 1, 2012
39.789
+0.336
0.85%
jan 1, 2013
40.204
+0.415
1.04%
Ranking of countries by current statistics by years


Comments: