29
/
en
AIzaSyAYiBZKx7MnpbEhh9jyipgxe19OcubqV5w
April 1, 2024
268777
Tunisia
TUN
true
2
1
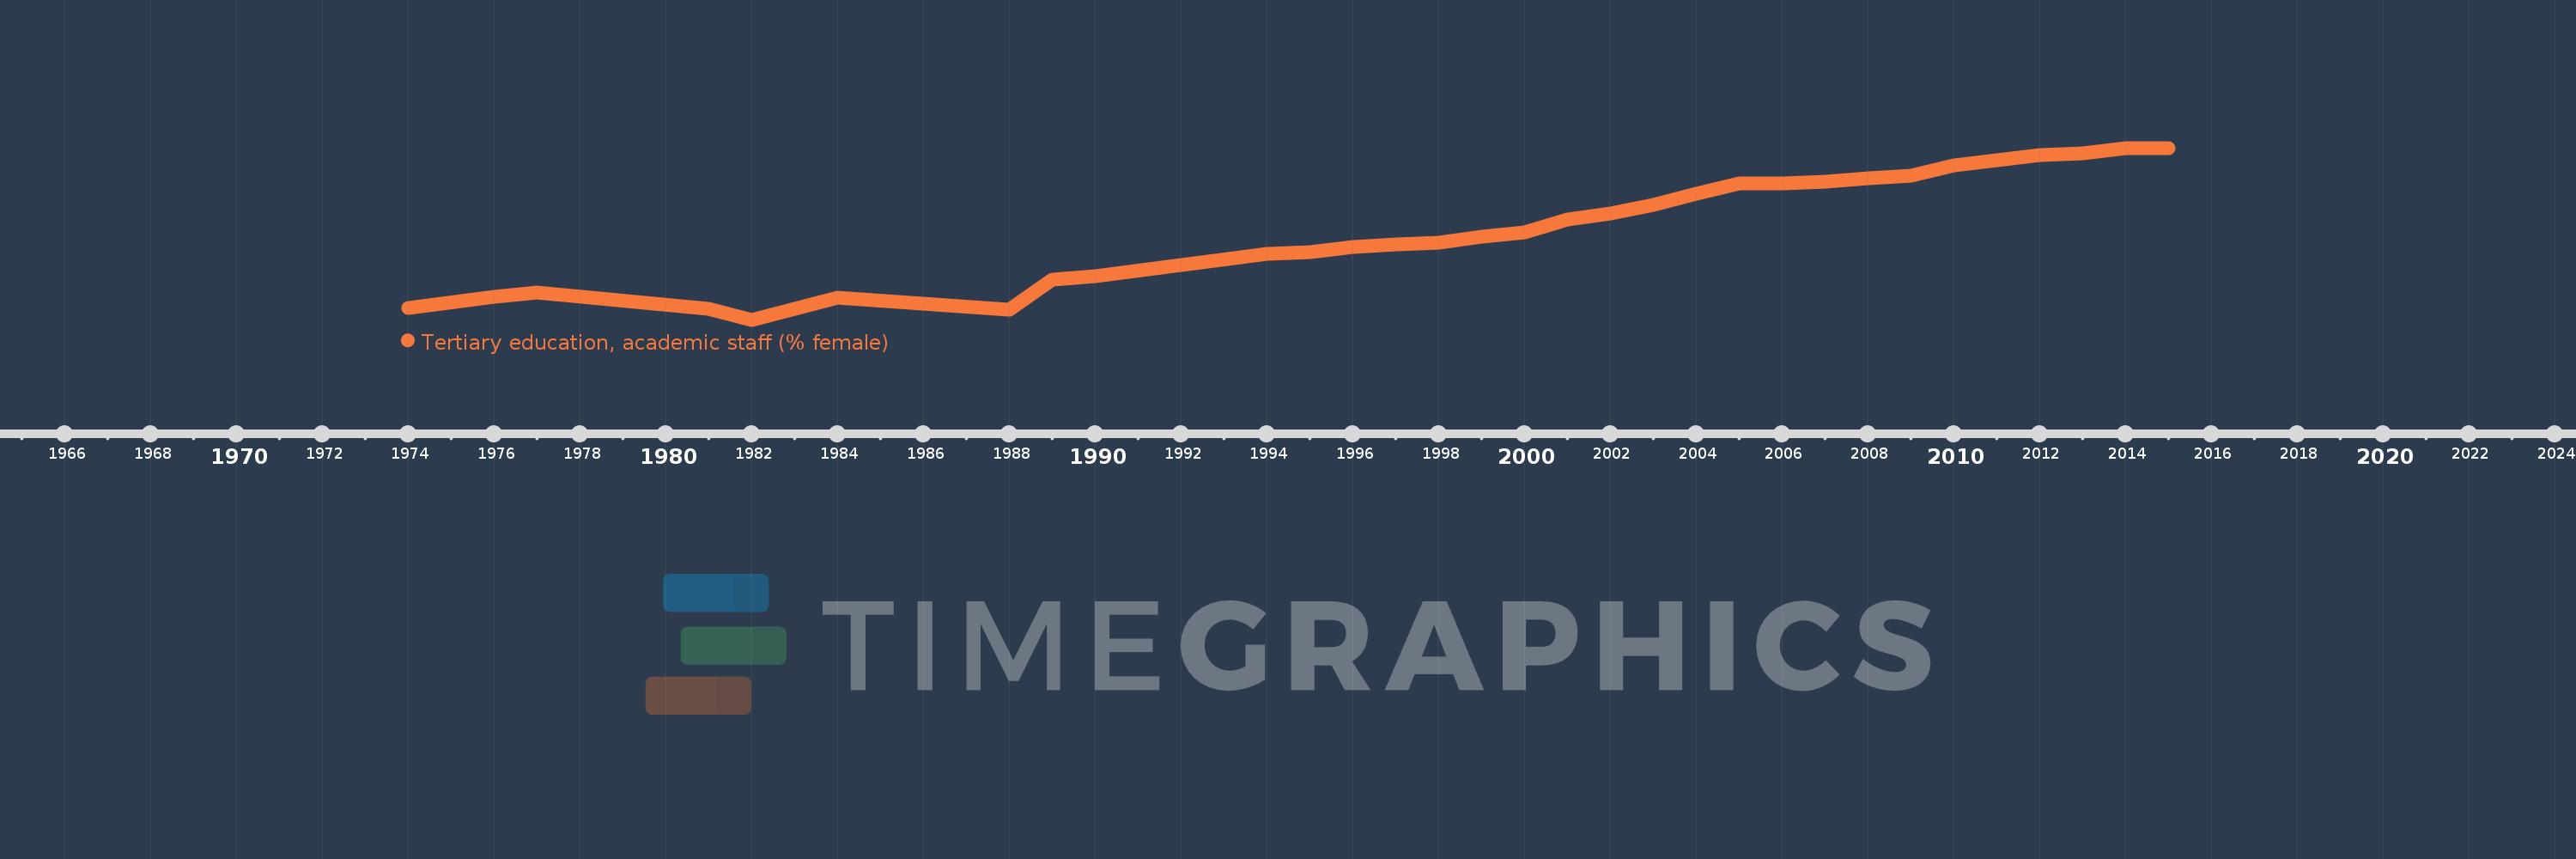
Tertiary education, academic staff (% female)
2015,2014,2013,2012,2011,2010,2009,2008,2007,2006,2005,2004,2003,2002,2001,2000,1999,1998,1997,1996,1995,1994,1990,1989,1988,1984,1982,1981,1977,1976,1974
This statistics in other country:
AfghanistanAlbaniaAlgeriaAndorraAngolaAntigua and BarbudaArab WorldArgentinaArmeniaArubaAustraliaAustriaAzerbaijanBahamas, TheBahrainBangladeshBarbadosBelarusBelgiumBelizeBeninBermudaBhutanBoliviaBosnia and HerzegovinaBotswanaBrazilBritish Virgin IslandsBrunei DarussalamBulgariaBurkina FasoBurundiCabo VerdeCambodiaCameroonCanadaCaribbean small statesCayman IslandsCentral African RepublicCentral Europe and the BalticsChadChileChinaColombiaComorosCongo, Dem. Rep.Congo, Rep.Costa RicaCote d'IvoireCroatiaCubaCyprusCzech RepublicDenmarkDjiboutiDominicaDominican RepublicEarly-demographic dividendEast Asia & PacificEast Asia & Pacific (excluding high income)East Asia & Pacific (IDA & IBRD countries)EcuadorEgypt, Arab Rep.El SalvadorEquatorial GuineaEritreaEstoniaEthiopiaEuro areaEurope & Central AsiaEurope & Central Asia (excluding high income)Europe & Central Asia (IDA & IBRD countries)European UnionFijiFinlandFragile and conflict affected situationsFranceGabonGambia, TheGeorgiaGermanyGhanaGreeceGrenadaGuineaGuyanaHaitiHeavily indebted poor countries (HIPC)High incomeHondurasHong Kong SAR, ChinaHungaryIBRD onlyIcelandIDA & IBRD totalIDA blendIDA onlyIDA totalIndiaIndonesiaIran, Islamic Rep.IraqIrelandItalyJamaicaJapanJordanKazakhstanKorea, Dem. People’s Rep.Korea, Rep.KuwaitKyrgyz RepublicLao PDRLate-demographic dividendLatin America & Caribbean Latin America & Caribbean (excluding high income)Latin America & the Caribbean (IDA & IBRD countries)LatviaLeast developed countries: UN classificationLebanonLesothoLiberiaLibyaLiechtensteinLithuaniaLow & middle incomeLow incomeLower middle incomeLuxembourgMacao SAR, ChinaMacedonia, FYRMadagascarMalawiMalaysiaMaldivesMaliMaltaMarshall IslandsMauritaniaMauritiusMicronesia, Fed. Sts.Middle East & North AfricaMiddle East & North Africa (excluding high income)Middle East & North Africa (IDA & IBRD countries)Middle incomeMoldovaMongoliaMoroccoMozambiqueMyanmarNamibiaNepalNetherlandsNew ZealandNicaraguaNigerNigeriaNorth AmericaNorwayOECD membersOmanOther small statesPacific island small statesPakistanPalauPanamaPapua New GuineaPeruPhilippinesPolandPortugalPost-demographic dividendPre-demographic dividendPuerto RicoQatarRomaniaRussian FederationRwandaSamoaSao Tome and PrincipeSaudi ArabiaSenegalSerbiaSeychellesSierra LeoneSingaporeSint Maarten (Dutch part)Slovak RepublicSloveniaSmall statesSomaliaSouth AfricaSouth AsiaSouth Asia (IDA & IBRD)SpainSri LankaSt. Kitts and NevisSt. LuciaSt. Vincent and the GrenadinesSub-Saharan Africa Sub-Saharan Africa (excluding high income)Sub-Saharan Africa (IDA & IBRD countries)SudanSurinameSwazilandSwedenSwitzerlandSyrian Arab RepublicTajikistanTanzaniaThailandTimor-LesteTogoTongaTrinidad and TobagoTunisiaTurkeyTurkmenistanUgandaUnited Arab EmiratesUnited KingdomUnited StatesUpper middle incomeUruguayUzbekistanVenezuela, RBVietnamWest Bank and GazaWorldYemen, Rep.Zimbabwe Timeline:
This timeline shows a graph from 1974 to 2015 of Tunisia. No data until 1973. Number of actual observations by date: 31.
Source name:
World Development Indicators
Source organization:
United Nations Educational, Scientific, and Cultural Organization (UNESCO) Institute for Statistics.
Categories, topics:
Education
Last updated:
apr 23, 2017
Indicators value changes by year
Maximum:
48.384
jan 1, 2015
At the date of observation
Value
Absolute change
Change from previous value
jan 1, 1974
11.538
+11.538
0.0%
jan 1, 1976
14.222
+2.684
23.26%
jan 1, 1977
15.207
+0.985
6.92%
jan 1, 1981
11.461
-3.745
-24.63%
jan 1, 1982
8.856
-2.605
-22.73%
jan 1, 1984
13.837
+4.98
56.24%
jan 1, 1988
11.1
-2.736
-19.78%
jan 1, 1989
17.999
+6.899
62.15%
jan 1, 1990
18.918
+0.919
5.1%
jan 1, 1994
23.955
+5.037
26.63%
jan 1, 1995
24.509
+0.554
2.31%
jan 1, 1996
25.555
+1.046
4.27%
jan 1, 1997
26.138
+0.583
2.28%
jan 1, 1998
26.592
+0.454
1.74%
jan 1, 1999
28.046
+1.454
5.47%
jan 1, 2000
29.052
+1.006
3.59%
jan 1, 2001
31.836
+2.783
9.58%
jan 1, 2002
33.304
+1.469
4.61%
jan 1, 2003
35.217
+1.913
5.74%
jan 1, 2004
37.76
+2.543
7.22%
jan 1, 2005
40.136
+2.376
6.29%
jan 1, 2006
40.22
+0.083
0.21%
jan 1, 2007
40.647
+0.427
1.06%
jan 1, 2008
41.387
+0.74
1.82%
jan 1, 2009
42.046
+0.66
1.59%
jan 1, 2010
44.296
+2.25
5.35%
jan 1, 2011
45.639
+1.342
3.03%
jan 1, 2012
46.706
+1.067
2.34%
jan 1, 2013
47.207
+0.501
1.07%
jan 1, 2014
48.242
+1.035
2.19%
jan 1, 2015
48.384
+0.142
0.29%
Ranking of countries by current statistics by years


Comments: