29
/
en
AIzaSyAYiBZKx7MnpbEhh9jyipgxe19OcubqV5w
April 1, 2024
52287
North America
NAC
false
2
1
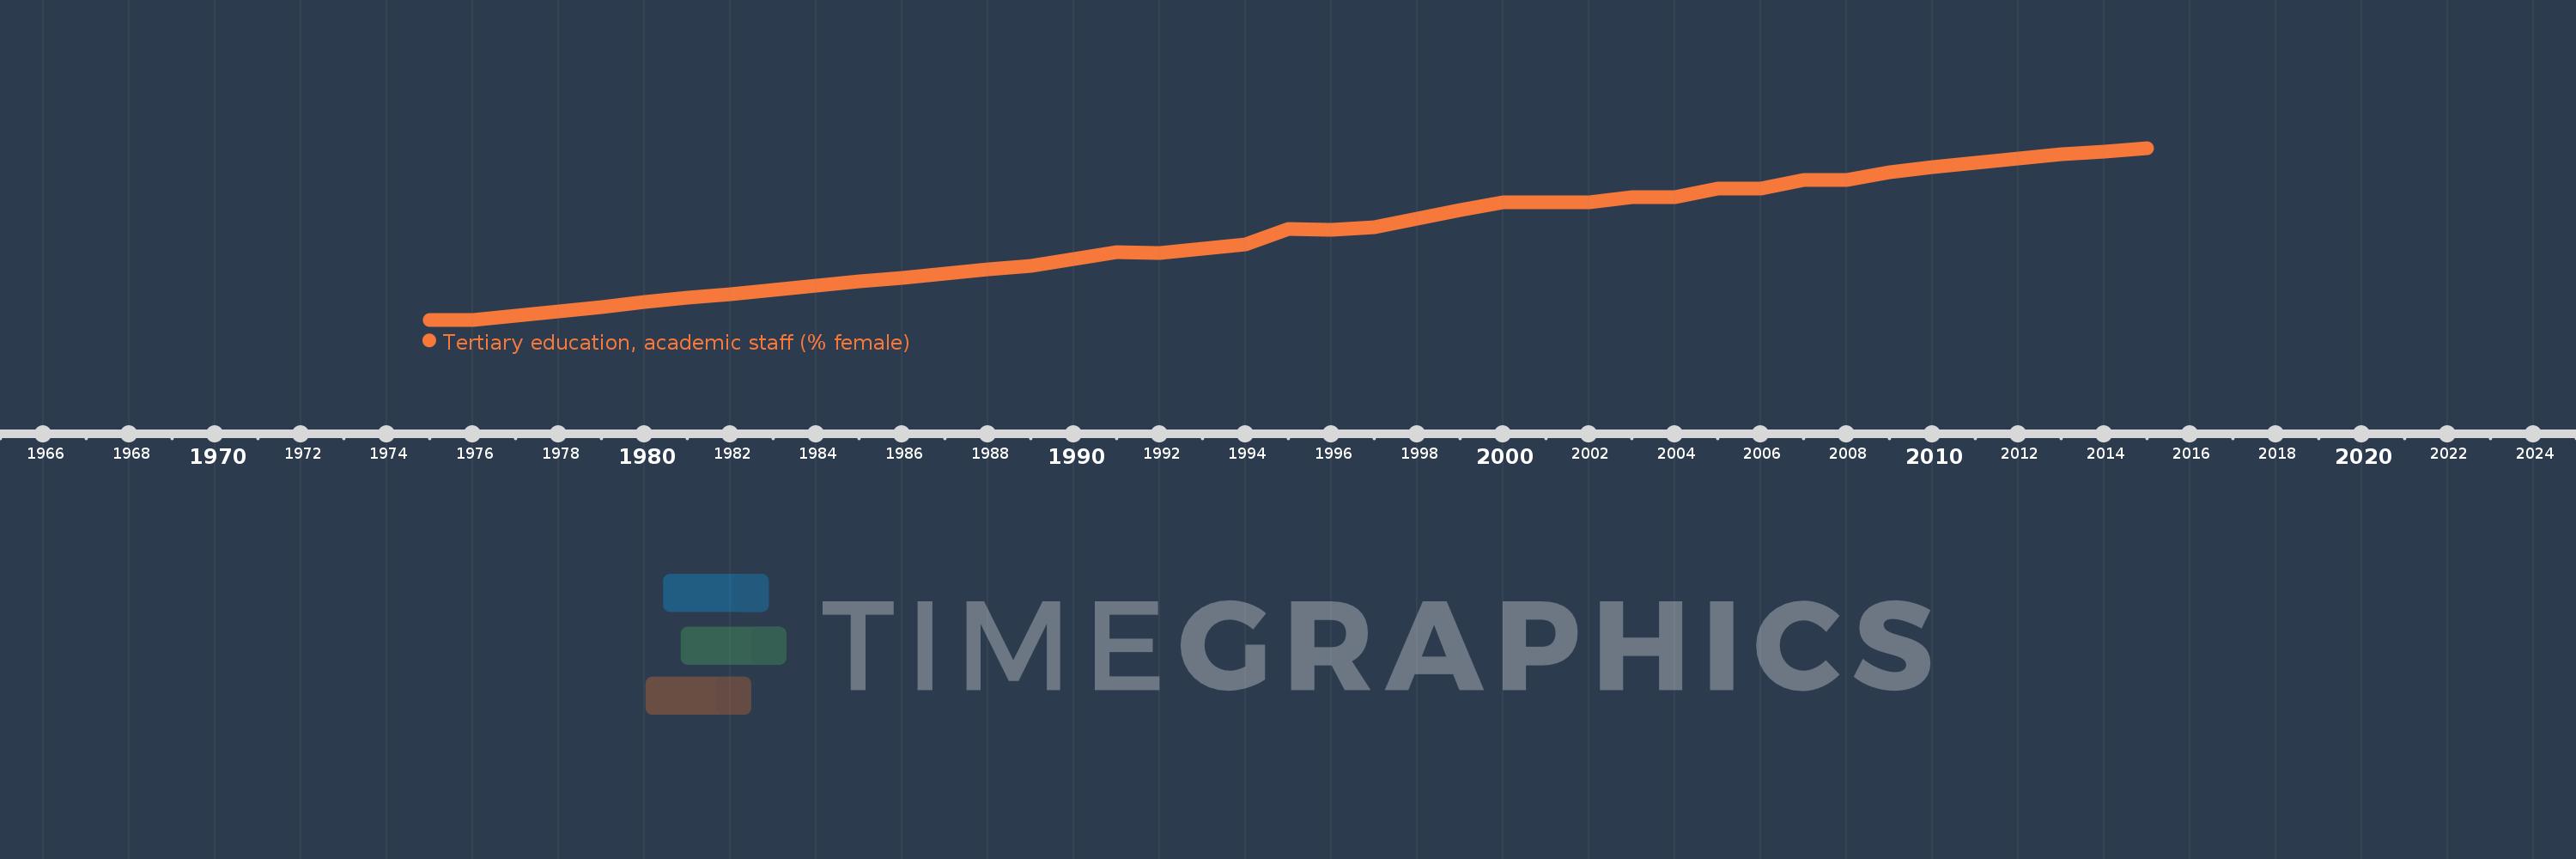
Tertiary education, academic staff (% female)
2015,2014,2013,2012,2011,2010,2009,2008,2007,2006,2005,2004,2003,2002,2001,2000,1999,1998,1997,1996,1995,1994,1993,1992,1991,1990,1989,1988,1987,1986,1985,1984,1983,1982,1981,1980,1979,1978,1977,1976,1975
This statistics in other country:
AfghanistanAlbaniaAlgeriaAndorraAngolaAntigua and BarbudaArab WorldArgentinaArmeniaArubaAustraliaAustriaAzerbaijanBahamas, TheBahrainBangladeshBarbadosBelarusBelgiumBelizeBeninBermudaBhutanBoliviaBosnia and HerzegovinaBotswanaBrazilBritish Virgin IslandsBrunei DarussalamBulgariaBurkina FasoBurundiCabo VerdeCambodiaCameroonCanadaCaribbean small statesCayman IslandsCentral African RepublicCentral Europe and the BalticsChadChileChinaColombiaComorosCongo, Dem. Rep.Congo, Rep.Costa RicaCote d'IvoireCroatiaCubaCyprusCzech RepublicDenmarkDjiboutiDominicaDominican RepublicEarly-demographic dividendEast Asia & PacificEast Asia & Pacific (excluding high income)East Asia & Pacific (IDA & IBRD countries)EcuadorEgypt, Arab Rep.El SalvadorEquatorial GuineaEritreaEstoniaEthiopiaEuro areaEurope & Central AsiaEurope & Central Asia (excluding high income)Europe & Central Asia (IDA & IBRD countries)European UnionFijiFinlandFragile and conflict affected situationsFranceGabonGambia, TheGeorgiaGermanyGhanaGreeceGrenadaGuineaGuyanaHaitiHeavily indebted poor countries (HIPC)High incomeHondurasHong Kong SAR, ChinaHungaryIBRD onlyIcelandIDA & IBRD totalIDA blendIDA onlyIDA totalIndiaIndonesiaIran, Islamic Rep.IraqIrelandItalyJamaicaJapanJordanKazakhstanKorea, Dem. People’s Rep.Korea, Rep.KuwaitKyrgyz RepublicLao PDRLate-demographic dividendLatin America & Caribbean Latin America & Caribbean (excluding high income)Latin America & the Caribbean (IDA & IBRD countries)LatviaLeast developed countries: UN classificationLebanonLesothoLiberiaLibyaLiechtensteinLithuaniaLow & middle incomeLow incomeLower middle incomeLuxembourgMacao SAR, ChinaMacedonia, FYRMadagascarMalawiMalaysiaMaldivesMaliMaltaMarshall IslandsMauritaniaMauritiusMicronesia, Fed. Sts.Middle East & North AfricaMiddle East & North Africa (excluding high income)Middle East & North Africa (IDA & IBRD countries)Middle incomeMoldovaMongoliaMoroccoMozambiqueMyanmarNamibiaNepalNetherlandsNew ZealandNicaraguaNigerNigeriaNorth AmericaNorwayOECD membersOmanOther small statesPacific island small statesPakistanPalauPanamaPapua New GuineaPeruPhilippinesPolandPortugalPost-demographic dividendPre-demographic dividendPuerto RicoQatarRomaniaRussian FederationRwandaSamoaSao Tome and PrincipeSaudi ArabiaSenegalSerbiaSeychellesSierra LeoneSingaporeSint Maarten (Dutch part)Slovak RepublicSloveniaSmall statesSomaliaSouth AfricaSouth AsiaSouth Asia (IDA & IBRD)SpainSri LankaSt. Kitts and NevisSt. LuciaSt. Vincent and the GrenadinesSub-Saharan Africa Sub-Saharan Africa (excluding high income)Sub-Saharan Africa (IDA & IBRD countries)SudanSurinameSwazilandSwedenSwitzerlandSyrian Arab RepublicTajikistanTanzaniaThailandTimor-LesteTogoTongaTrinidad and TobagoTunisiaTurkeyTurkmenistanUgandaUnited Arab EmiratesUnited KingdomUnited StatesUpper middle incomeUruguayUzbekistanVenezuela, RBVietnamWest Bank and GazaWorldYemen, Rep.Zimbabwe Timeline:
This timeline shows a graph from 1975 to 2015 of North America. No data until 1974. Number of actual observations by date: 41.
Source name:
World Development Indicators
Source organization:
United Nations Educational, Scientific, and Cultural Organization (UNESCO) Institute for Statistics.
Categories, topics:
Education
Last updated:
apr 23, 2017
Indicators value changes by year
Minimum:
26.381
jan 1, 1975
Maximum:
48.294
jan 1, 2015
At the date of observation
Value
Absolute change
Change from previous value
jan 1, 1975
26.381
+26.381
0.0%
jan 1, 1976
26.386
+0.005
0.02%
jan 1, 1977
26.884
+0.498
1.89%
jan 1, 1978
27.448
+0.564
2.1%
jan 1, 1979
28.018
+0.57
2.08%
jan 1, 1980
28.598
+0.581
2.07%
jan 1, 1981
29.146
+0.547
1.91%
jan 1, 1982
29.673
+0.527
1.81%
jan 1, 1983
30.204
+0.532
1.79%
jan 1, 1984
30.736
+0.531
1.76%
jan 1, 1985
31.256
+0.52
1.69%
jan 1, 1986
31.764
+0.508
1.63%
jan 1, 1987
32.267
+0.503
1.58%
jan 1, 1988
32.768
+0.501
1.55%
jan 1, 1989
33.259
+0.491
1.5%
jan 1, 1990
34.108
+0.85
2.56%
jan 1, 1991
34.95
+0.842
2.47%
jan 1, 1992
34.939
-0.011
-0.03%
jan 1, 1993
35.433
+0.494
1.41%
jan 1, 1994
35.974
+0.541
1.53%
jan 1, 1995
37.923
+1.949
5.42%
jan 1, 1996
37.846
-0.076
-0.2%
jan 1, 1997
38.138
+0.292
0.77%
jan 1, 1998
39.25
+1.112
2.92%
jan 1, 1999
40.327
+1.077
2.74%
jan 1, 2000
41.358
+1.031
2.56%
jan 1, 2001
41.358
+0.0
0.0%
jan 1, 2002
41.357
-0.002
0.0%
jan 1, 2003
41.994
+0.638
1.54%
jan 1, 2004
42.025
+0.03
0.07%
jan 1, 2005
43.154
+1.129
2.69%
jan 1, 2006
43.1
-0.054
-0.13%
jan 1, 2007
44.241
+1.141
2.65%
jan 1, 2008
44.233
-0.008
-0.02%
jan 1, 2009
45.234
+1.001
2.26%
jan 1, 2010
45.842
+0.608
1.34%
jan 1, 2011
46.4
+0.558
1.22%
jan 1, 2012
46.978
+0.578
1.24%
jan 1, 2013
47.465
+0.487
1.04%
jan 1, 2014
47.825
+0.36
0.76%
jan 1, 2015
48.294
+0.469
0.98%
Ranking of countries by current statistics by years


Comments: