29
/
en
AIzaSyAYiBZKx7MnpbEhh9jyipgxe19OcubqV5w
April 1, 2024
43924
Latin America & the Caribbean (IDA & IBRD countries)
TLA
false
2
1
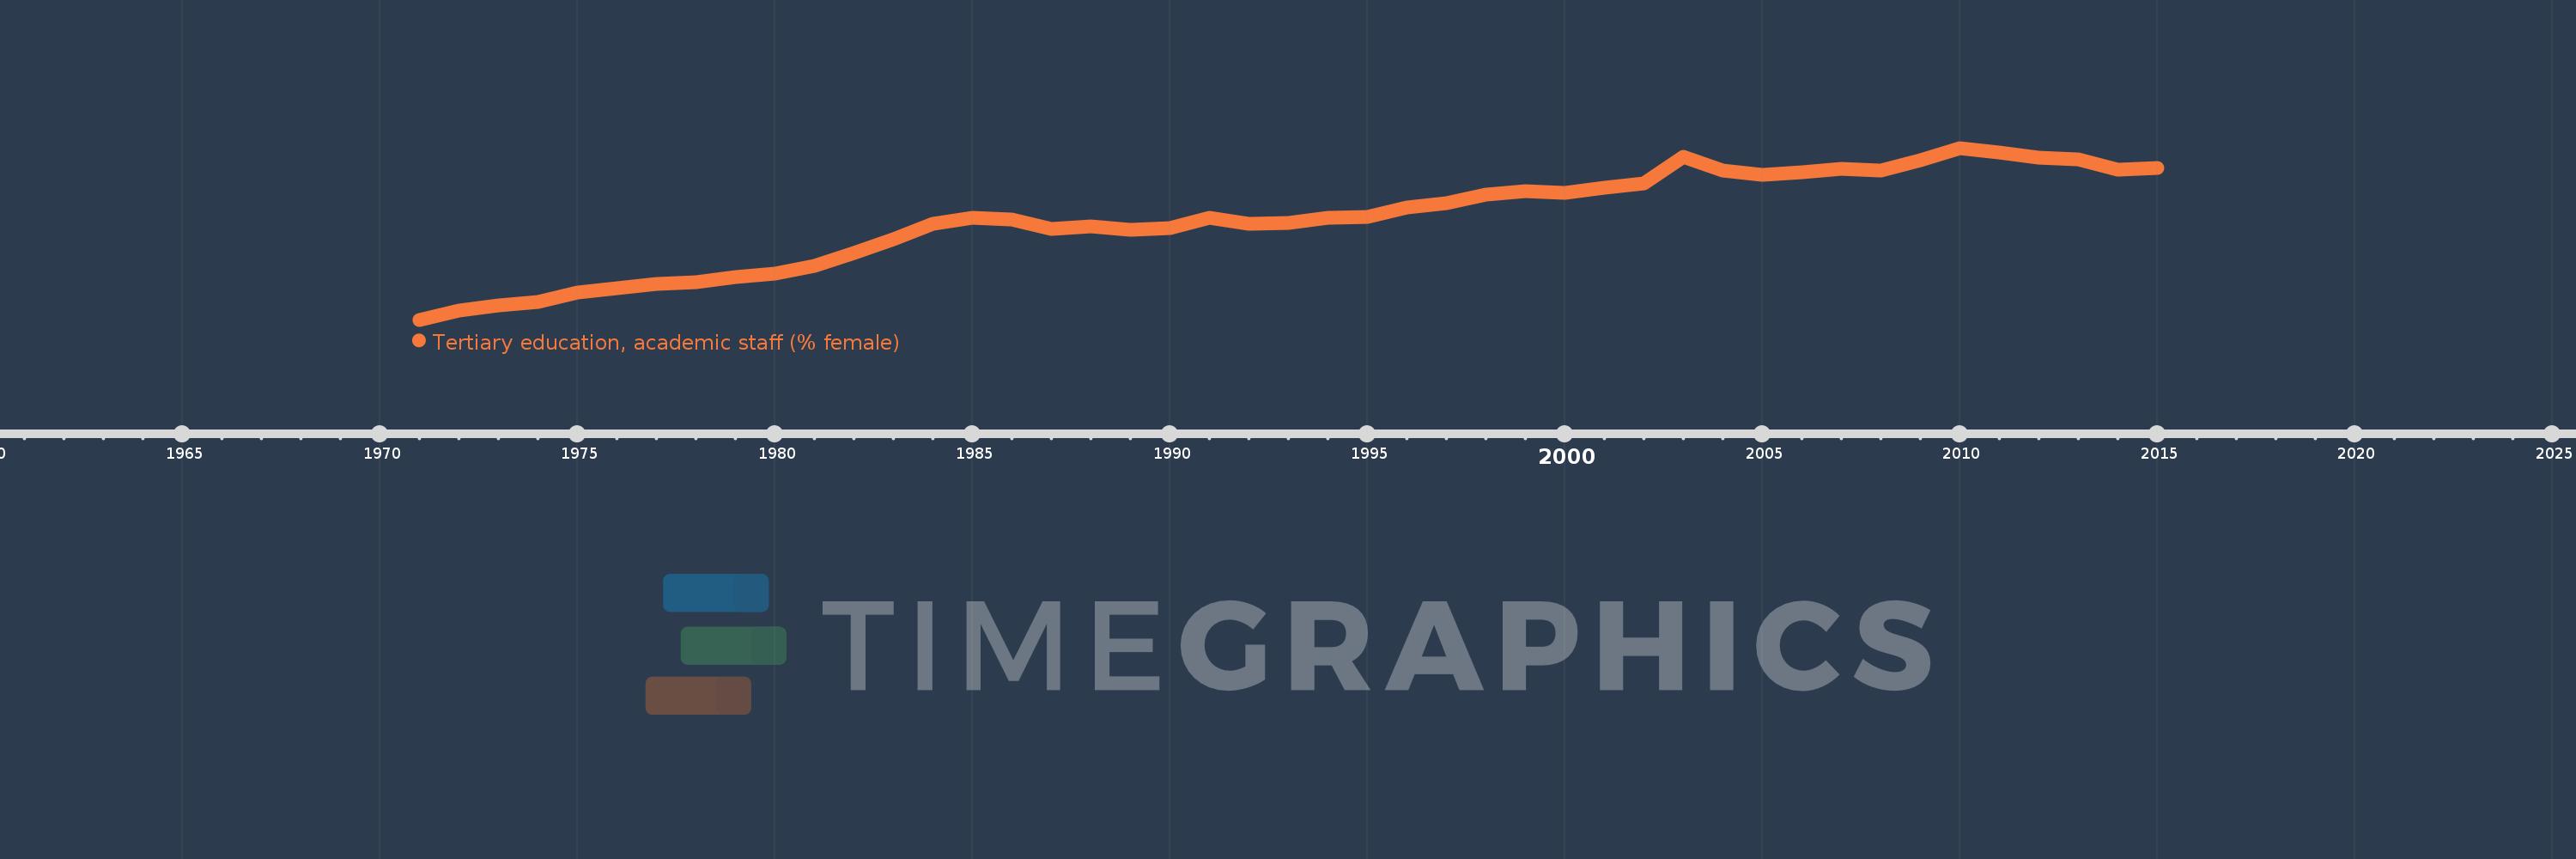
Tertiary education, academic staff (% female)
2015,2014,2013,2012,2011,2010,2009,2008,2007,2006,2005,2004,2003,2002,2001,2000,1999,1998,1997,1996,1995,1994,1993,1992,1991,1990,1989,1988,1987,1986,1985,1984,1983,1982,1981,1980,1979,1978,1977,1976,1975,1974,1973,1972,1971
This statistics in other country:
AfghanistanAlbaniaAlgeriaAndorraAngolaAntigua and BarbudaArab WorldArgentinaArmeniaArubaAustraliaAustriaAzerbaijanBahamas, TheBahrainBangladeshBarbadosBelarusBelgiumBelizeBeninBermudaBhutanBoliviaBosnia and HerzegovinaBotswanaBrazilBritish Virgin IslandsBrunei DarussalamBulgariaBurkina FasoBurundiCabo VerdeCambodiaCameroonCanadaCaribbean small statesCayman IslandsCentral African RepublicCentral Europe and the BalticsChadChileChinaColombiaComorosCongo, Dem. Rep.Congo, Rep.Costa RicaCote d'IvoireCroatiaCubaCyprusCzech RepublicDenmarkDjiboutiDominicaDominican RepublicEarly-demographic dividendEast Asia & PacificEast Asia & Pacific (excluding high income)East Asia & Pacific (IDA & IBRD countries)EcuadorEgypt, Arab Rep.El SalvadorEquatorial GuineaEritreaEstoniaEthiopiaEuro areaEurope & Central AsiaEurope & Central Asia (excluding high income)Europe & Central Asia (IDA & IBRD countries)European UnionFijiFinlandFragile and conflict affected situationsFranceGabonGambia, TheGeorgiaGermanyGhanaGreeceGrenadaGuineaGuyanaHaitiHeavily indebted poor countries (HIPC)High incomeHondurasHong Kong SAR, ChinaHungaryIBRD onlyIcelandIDA & IBRD totalIDA blendIDA onlyIDA totalIndiaIndonesiaIran, Islamic Rep.IraqIrelandItalyJamaicaJapanJordanKazakhstanKorea, Dem. People’s Rep.Korea, Rep.KuwaitKyrgyz RepublicLao PDRLate-demographic dividendLatin America & Caribbean Latin America & Caribbean (excluding high income)Latin America & the Caribbean (IDA & IBRD countries)LatviaLeast developed countries: UN classificationLebanonLesothoLiberiaLibyaLiechtensteinLithuaniaLow & middle incomeLow incomeLower middle incomeLuxembourgMacao SAR, ChinaMacedonia, FYRMadagascarMalawiMalaysiaMaldivesMaliMaltaMarshall IslandsMauritaniaMauritiusMicronesia, Fed. Sts.Middle East & North AfricaMiddle East & North Africa (excluding high income)Middle East & North Africa (IDA & IBRD countries)Middle incomeMoldovaMongoliaMoroccoMozambiqueMyanmarNamibiaNepalNetherlandsNew ZealandNicaraguaNigerNigeriaNorth AmericaNorwayOECD membersOmanOther small statesPacific island small statesPakistanPalauPanamaPapua New GuineaPeruPhilippinesPolandPortugalPost-demographic dividendPre-demographic dividendPuerto RicoQatarRomaniaRussian FederationRwandaSamoaSao Tome and PrincipeSaudi ArabiaSenegalSerbiaSeychellesSierra LeoneSingaporeSint Maarten (Dutch part)Slovak RepublicSloveniaSmall statesSomaliaSouth AfricaSouth AsiaSouth Asia (IDA & IBRD)SpainSri LankaSt. Kitts and NevisSt. LuciaSt. Vincent and the GrenadinesSub-Saharan Africa Sub-Saharan Africa (excluding high income)Sub-Saharan Africa (IDA & IBRD countries)SudanSurinameSwazilandSwedenSwitzerlandSyrian Arab RepublicTajikistanTanzaniaThailandTimor-LesteTogoTongaTrinidad and TobagoTunisiaTurkeyTurkmenistanUgandaUnited Arab EmiratesUnited KingdomUnited StatesUpper middle incomeUruguayUzbekistanVenezuela, RBVietnamWest Bank and GazaWorldYemen, Rep.Zimbabwe Timeline:
This timeline shows a graph from 1971 to 2015 of Latin America & the Caribbean (IDA & IBRD countries). No data until 1970. Number of actual observations by date: 45.
Source name:
World Development Indicators
Source organization:
United Nations Educational, Scientific, and Cultural Organization (UNESCO) Institute for Statistics.
Categories, topics:
Education
Last updated:
apr 23, 2017
Indicators value changes by year
Minimum:
22.431
jan 1, 1971
At the date of observation
Value
Absolute change
Change from previous value
jan 1, 1971
22.431
+22.431
0.0%
jan 1, 1972
23.465
+1.034
4.61%
jan 1, 1973
24.09
+0.625
2.66%
jan 1, 1974
24.511
+0.421
1.75%
jan 1, 1975
25.621
+1.109
4.53%
jan 1, 1976
26.06
+0.439
1.71%
jan 1, 1977
26.54
+0.481
1.85%
jan 1, 1978
26.779
+0.238
0.9%
jan 1, 1979
27.382
+0.604
2.26%
jan 1, 1980
27.784
+0.401
1.46%
jan 1, 1981
28.709
+0.925
3.33%
jan 1, 1982
30.188
+1.48
5.15%
jan 1, 1983
31.732
+1.544
5.12%
jan 1, 1984
33.555
+1.822
5.74%
jan 1, 1985
34.256
+0.701
2.09%
jan 1, 1986
34.034
-0.222
-0.65%
jan 1, 1987
32.986
-1.048
-3.08%
jan 1, 1988
33.216
+0.23
0.7%
jan 1, 1989
32.823
-0.393
-1.18%
jan 1, 1990
33.015
+0.192
0.58%
jan 1, 1991
34.255
+1.24
3.76%
jan 1, 1992
33.511
-0.744
-2.17%
jan 1, 1993
33.632
+0.121
0.36%
jan 1, 1994
34.199
+0.567
1.69%
jan 1, 1995
34.325
+0.126
0.37%
jan 1, 1996
35.379
+1.054
3.07%
jan 1, 1997
35.968
+0.589
1.66%
jan 1, 1998
36.907
+0.94
2.61%
jan 1, 1999
37.312
+0.405
1.1%
jan 1, 2000
37.11
-0.201
-0.54%
jan 1, 2001
37.757
+0.647
1.74%
jan 1, 2002
38.218
+0.461
1.22%
jan 1, 2003
41.273
+3.054
7.99%
jan 1, 2004
39.693
-1.58
-3.83%
jan 1, 2005
39.17
-0.523
-1.32%
jan 1, 2006
39.491
+0.321
0.82%
jan 1, 2007
39.952
+0.461
1.17%
jan 1, 2008
39.666
-0.286
-0.71%
jan 1, 2009
40.91
+1.244
3.14%
jan 1, 2010
42.32
+1.41
3.45%
jan 1, 2011
41.783
-0.538
-1.27%
jan 1, 2012
41.231
-0.551
-1.32%
jan 1, 2013
40.949
-0.283
-0.69%
jan 1, 2014
39.817
-1.132
-2.76%
jan 1, 2015
40.008
+0.191
0.48%
Ranking of countries by current statistics by years


Comments: