29
/
en
AIzaSyAYiBZKx7MnpbEhh9jyipgxe19OcubqV5w
April 1, 2024
243196
Slovenia
SVN
true
2
1
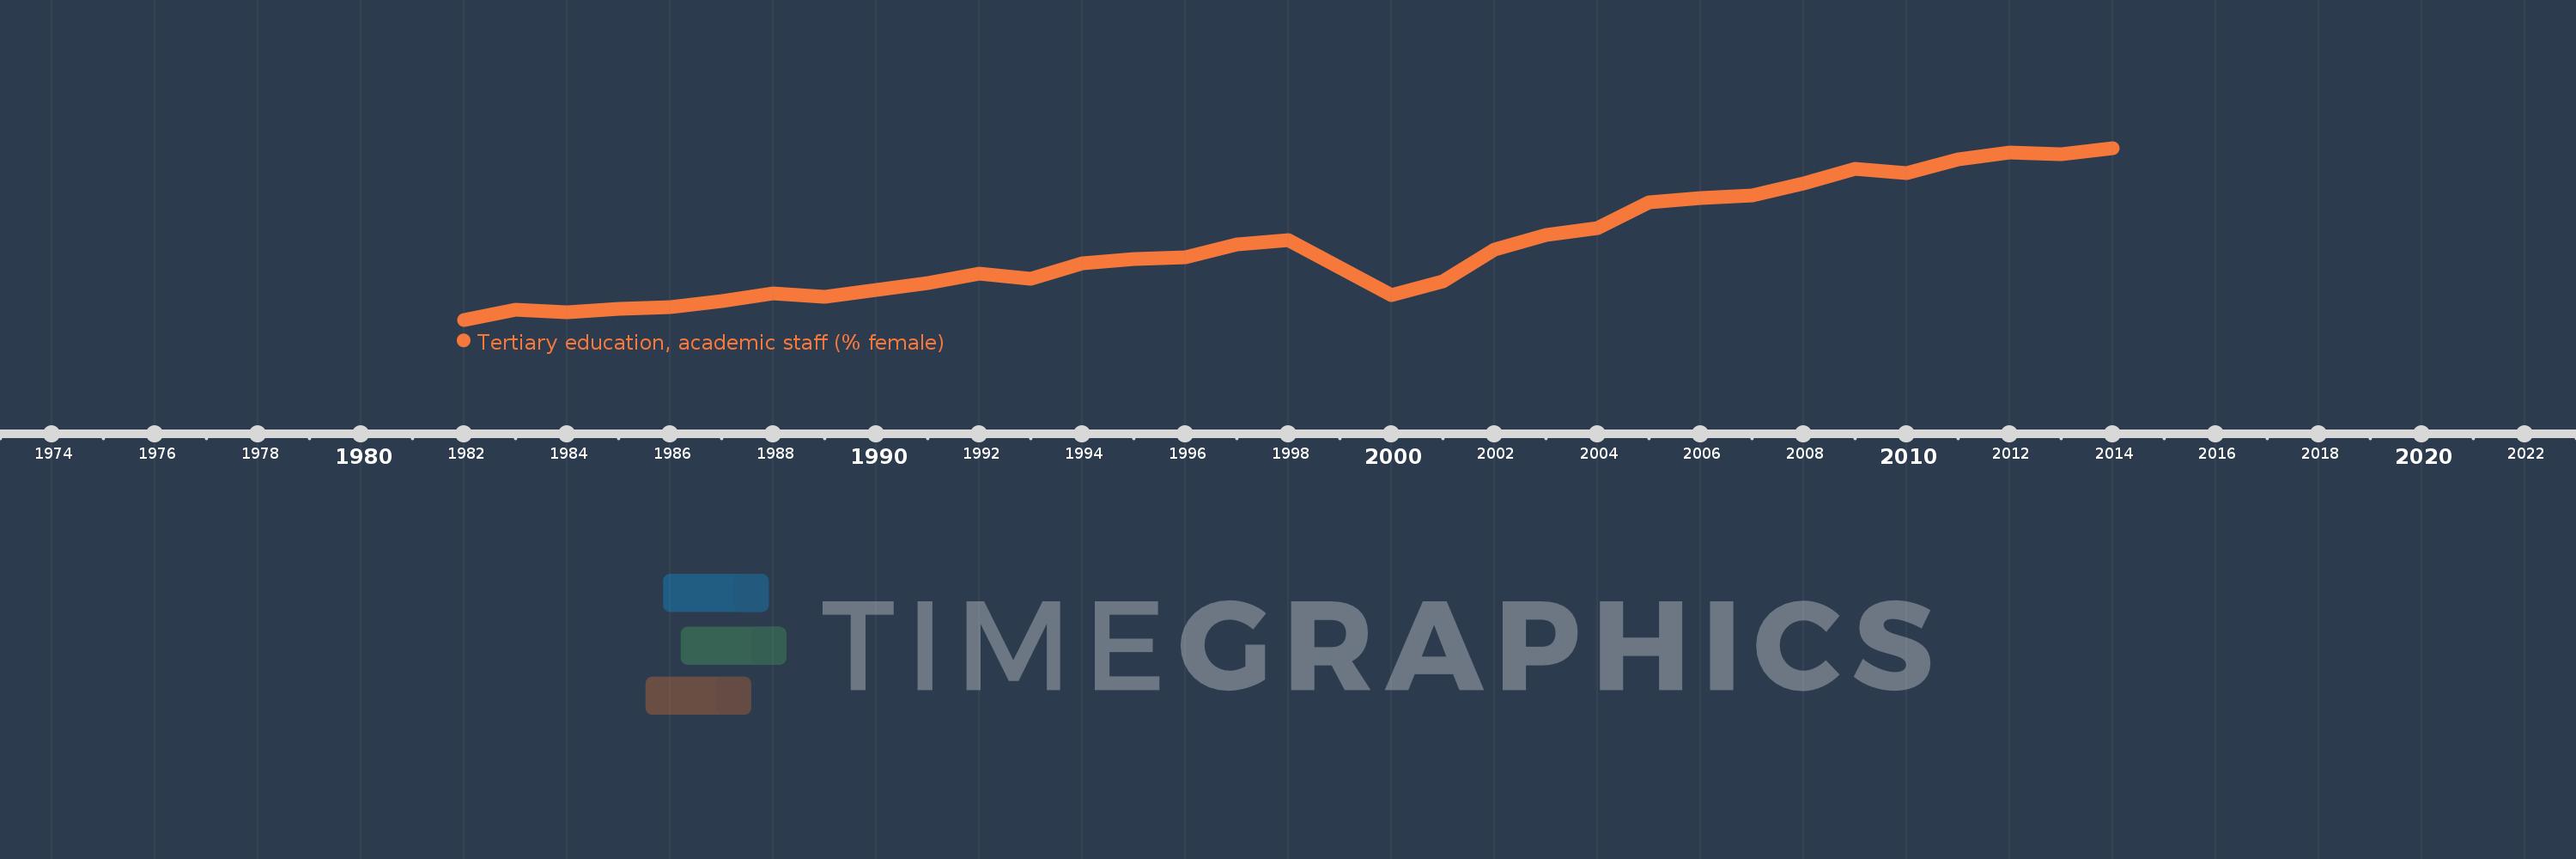
Tertiary education, academic staff (% female)
2014,2013,2012,2011,2010,2009,2008,2007,2006,2005,2004,2003,2002,2001,2000,1998,1997,1996,1995,1994,1993,1992,1991,1989,1988,1987,1986,1985,1984,1983,1982
This statistics in other country:
AfghanistanAlbaniaAlgeriaAndorraAngolaAntigua and BarbudaArab WorldArgentinaArmeniaArubaAustraliaAustriaAzerbaijanBahamas, TheBahrainBangladeshBarbadosBelarusBelgiumBelizeBeninBermudaBhutanBoliviaBosnia and HerzegovinaBotswanaBrazilBritish Virgin IslandsBrunei DarussalamBulgariaBurkina FasoBurundiCabo VerdeCambodiaCameroonCanadaCaribbean small statesCayman IslandsCentral African RepublicCentral Europe and the BalticsChadChileChinaColombiaComorosCongo, Dem. Rep.Congo, Rep.Costa RicaCote d'IvoireCroatiaCubaCyprusCzech RepublicDenmarkDjiboutiDominicaDominican RepublicEarly-demographic dividendEast Asia & PacificEast Asia & Pacific (excluding high income)East Asia & Pacific (IDA & IBRD countries)EcuadorEgypt, Arab Rep.El SalvadorEquatorial GuineaEritreaEstoniaEthiopiaEuro areaEurope & Central AsiaEurope & Central Asia (excluding high income)Europe & Central Asia (IDA & IBRD countries)European UnionFijiFinlandFragile and conflict affected situationsFranceGabonGambia, TheGeorgiaGermanyGhanaGreeceGrenadaGuineaGuyanaHaitiHeavily indebted poor countries (HIPC)High incomeHondurasHong Kong SAR, ChinaHungaryIBRD onlyIcelandIDA & IBRD totalIDA blendIDA onlyIDA totalIndiaIndonesiaIran, Islamic Rep.IraqIrelandItalyJamaicaJapanJordanKazakhstanKorea, Dem. People’s Rep.Korea, Rep.KuwaitKyrgyz RepublicLao PDRLate-demographic dividendLatin America & Caribbean Latin America & Caribbean (excluding high income)Latin America & the Caribbean (IDA & IBRD countries)LatviaLeast developed countries: UN classificationLebanonLesothoLiberiaLibyaLiechtensteinLithuaniaLow & middle incomeLow incomeLower middle incomeLuxembourgMacao SAR, ChinaMacedonia, FYRMadagascarMalawiMalaysiaMaldivesMaliMaltaMarshall IslandsMauritaniaMauritiusMicronesia, Fed. Sts.Middle East & North AfricaMiddle East & North Africa (excluding high income)Middle East & North Africa (IDA & IBRD countries)Middle incomeMoldovaMongoliaMoroccoMozambiqueMyanmarNamibiaNepalNetherlandsNew ZealandNicaraguaNigerNigeriaNorth AmericaNorwayOECD membersOmanOther small statesPacific island small statesPakistanPalauPanamaPapua New GuineaPeruPhilippinesPolandPortugalPost-demographic dividendPre-demographic dividendPuerto RicoQatarRomaniaRussian FederationRwandaSamoaSao Tome and PrincipeSaudi ArabiaSenegalSerbiaSeychellesSierra LeoneSingaporeSint Maarten (Dutch part)Slovak RepublicSloveniaSmall statesSomaliaSouth AfricaSouth AsiaSouth Asia (IDA & IBRD)SpainSri LankaSt. Kitts and NevisSt. LuciaSt. Vincent and the GrenadinesSub-Saharan Africa Sub-Saharan Africa (excluding high income)Sub-Saharan Africa (IDA & IBRD countries)SudanSurinameSwazilandSwedenSwitzerlandSyrian Arab RepublicTajikistanTanzaniaThailandTimor-LesteTogoTongaTrinidad and TobagoTunisiaTurkeyTurkmenistanUgandaUnited Arab EmiratesUnited KingdomUnited StatesUpper middle incomeUruguayUzbekistanVenezuela, RBVietnamWest Bank and GazaWorldYemen, Rep.Zimbabwe Timeline:
This timeline shows a graph from 1982 to 2014 of Slovenia. No data until 1981. Number of actual observations by date: 31.
Source name:
World Development Indicators
Source organization:
United Nations Educational, Scientific, and Cultural Organization (UNESCO) Institute for Statistics.
Categories, topics:
Education
Last updated:
apr 23, 2017
Indicators value changes by year
Minimum:
18.248
jan 1, 1982
Maximum:
39.741
jan 1, 2014
At the date of observation
Value
Absolute change
Change from previous value
jan 1, 1982
18.248
+18.248
0.0%
jan 1, 1983
19.459
+1.212
6.64%
jan 1, 1984
19.21
-0.249
-1.28%
jan 1, 1985
19.662
+0.452
2.35%
jan 1, 1986
19.859
+0.197
1.0%
jan 1, 1987
20.577
+0.718
3.62%
jan 1, 1988
21.511
+0.934
4.54%
jan 1, 1989
21.074
-0.437
-2.03%
jan 1, 1991
22.865
+1.791
8.5%
jan 1, 1992
24.042
+1.177
5.15%
jan 1, 1993
23.342
-0.7
-2.91%
jan 1, 1994
25.261
+1.918
8.22%
jan 1, 1995
25.82
+0.559
2.21%
jan 1, 1996
26.107
+0.287
1.11%
jan 1, 1997
27.678
+1.571
6.02%
jan 1, 1998
28.231
+0.553
2.0%
jan 1, 2000
21.385
-6.846
-24.25%
jan 1, 2001
23.083
+1.698
7.94%
jan 1, 2002
27.005
+3.922
16.99%
jan 1, 2003
28.846
+1.841
6.82%
jan 1, 2004
29.688
+0.842
2.92%
jan 1, 2005
32.899
+3.211
10.82%
jan 1, 2006
33.453
+0.554
1.68%
jan 1, 2007
33.816
+0.364
1.09%
jan 1, 2008
35.354
+1.538
4.55%
jan 1, 2009
37.178
+1.824
5.16%
jan 1, 2010
36.603
-0.575
-1.55%
jan 1, 2011
38.333
+1.73
4.73%
jan 1, 2012
39.118
+0.785
2.05%
jan 1, 2013
39.004
-0.115
-0.29%
jan 1, 2014
39.741
+0.737
1.89%
Ranking of countries by current statistics by years


Comments: