29
/
en
AIzaSyAYiBZKx7MnpbEhh9jyipgxe19OcubqV5w
April 1, 2024
63089
World
WLD
false
2
1
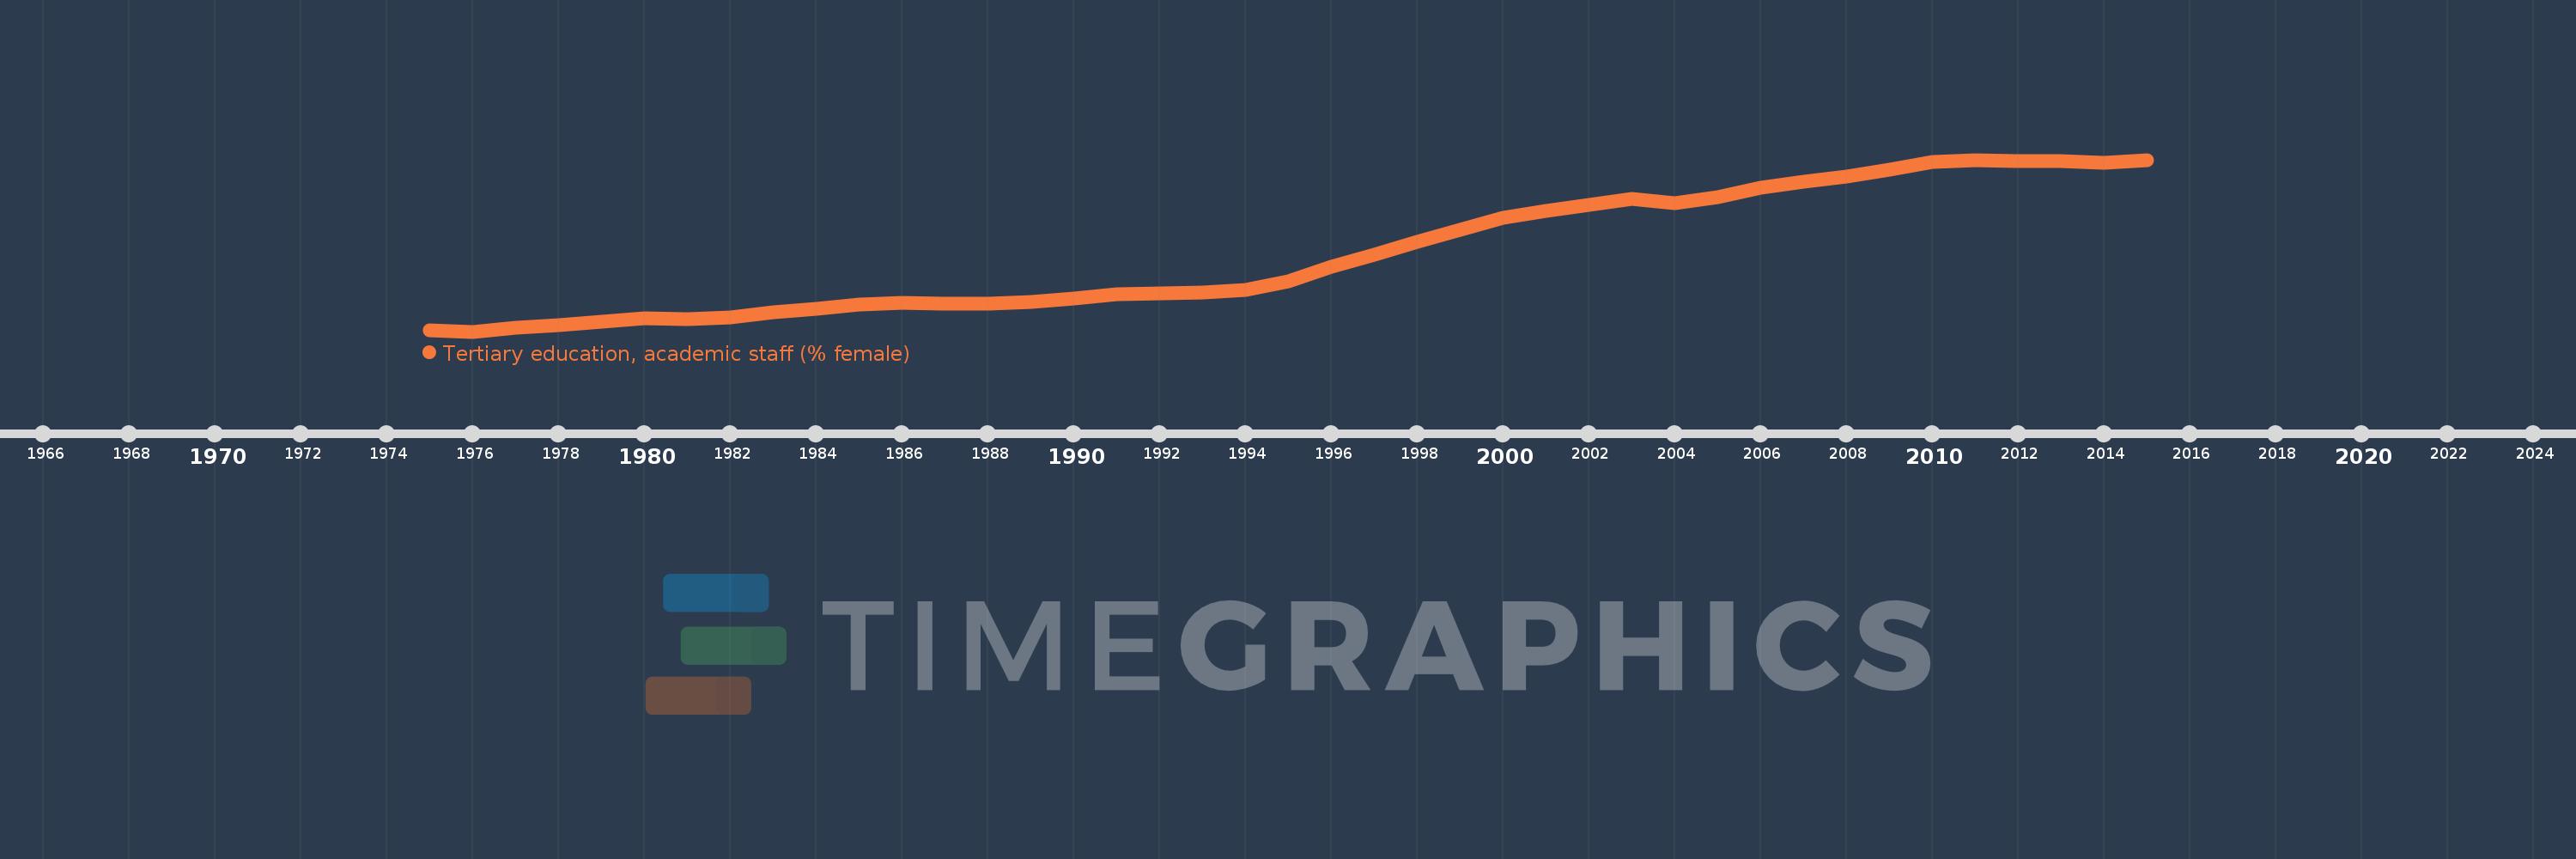
Tertiary education, academic staff (% female)
2015,2014,2013,2012,2011,2010,2009,2008,2007,2006,2005,2004,2003,2002,2001,2000,1999,1998,1997,1996,1995,1994,1993,1992,1991,1990,1989,1988,1987,1986,1985,1984,1983,1982,1981,1980,1979,1978,1977,1976,1975
This statistics in other country:
AfghanistanAlbaniaAlgeriaAndorraAngolaAntigua and BarbudaArab WorldArgentinaArmeniaArubaAustraliaAustriaAzerbaijanBahamas, TheBahrainBangladeshBarbadosBelarusBelgiumBelizeBeninBermudaBhutanBoliviaBosnia and HerzegovinaBotswanaBrazilBritish Virgin IslandsBrunei DarussalamBulgariaBurkina FasoBurundiCabo VerdeCambodiaCameroonCanadaCaribbean small statesCayman IslandsCentral African RepublicCentral Europe and the BalticsChadChileChinaColombiaComorosCongo, Dem. Rep.Congo, Rep.Costa RicaCote d'IvoireCroatiaCubaCyprusCzech RepublicDenmarkDjiboutiDominicaDominican RepublicEarly-demographic dividendEast Asia & PacificEast Asia & Pacific (excluding high income)East Asia & Pacific (IDA & IBRD countries)EcuadorEgypt, Arab Rep.El SalvadorEquatorial GuineaEritreaEstoniaEthiopiaEuro areaEurope & Central AsiaEurope & Central Asia (excluding high income)Europe & Central Asia (IDA & IBRD countries)European UnionFijiFinlandFragile and conflict affected situationsFranceGabonGambia, TheGeorgiaGermanyGhanaGreeceGrenadaGuineaGuyanaHaitiHeavily indebted poor countries (HIPC)High incomeHondurasHong Kong SAR, ChinaHungaryIBRD onlyIcelandIDA & IBRD totalIDA blendIDA onlyIDA totalIndiaIndonesiaIran, Islamic Rep.IraqIrelandItalyJamaicaJapanJordanKazakhstanKorea, Dem. People’s Rep.Korea, Rep.KuwaitKyrgyz RepublicLao PDRLate-demographic dividendLatin America & Caribbean Latin America & Caribbean (excluding high income)Latin America & the Caribbean (IDA & IBRD countries)LatviaLeast developed countries: UN classificationLebanonLesothoLiberiaLibyaLiechtensteinLithuaniaLow & middle incomeLow incomeLower middle incomeLuxembourgMacao SAR, ChinaMacedonia, FYRMadagascarMalawiMalaysiaMaldivesMaliMaltaMarshall IslandsMauritaniaMauritiusMicronesia, Fed. Sts.Middle East & North AfricaMiddle East & North Africa (excluding high income)Middle East & North Africa (IDA & IBRD countries)Middle incomeMoldovaMongoliaMoroccoMozambiqueMyanmarNamibiaNepalNetherlandsNew ZealandNicaraguaNigerNigeriaNorth AmericaNorwayOECD membersOmanOther small statesPacific island small statesPakistanPalauPanamaPapua New GuineaPeruPhilippinesPolandPortugalPost-demographic dividendPre-demographic dividendPuerto RicoQatarRomaniaRussian FederationRwandaSamoaSao Tome and PrincipeSaudi ArabiaSenegalSerbiaSeychellesSierra LeoneSingaporeSint Maarten (Dutch part)Slovak RepublicSloveniaSmall statesSomaliaSouth AfricaSouth AsiaSouth Asia (IDA & IBRD)SpainSri LankaSt. Kitts and NevisSt. LuciaSt. Vincent and the GrenadinesSub-Saharan Africa Sub-Saharan Africa (excluding high income)Sub-Saharan Africa (IDA & IBRD countries)SudanSurinameSwazilandSwedenSwitzerlandSyrian Arab RepublicTajikistanTanzaniaThailandTimor-LesteTogoTongaTrinidad and TobagoTunisiaTurkeyTurkmenistanUgandaUnited Arab EmiratesUnited KingdomUnited StatesUpper middle incomeUruguayUzbekistanVenezuela, RBVietnamWest Bank and GazaWorldYemen, Rep.Zimbabwe Timeline:
This timeline shows a graph from 1975 to 2015 of World. No data until 1974. Number of actual observations by date: 41.
Source name:
World Development Indicators
Source organization:
United Nations Educational, Scientific, and Cultural Organization (UNESCO) Institute for Statistics.
Categories, topics:
Education
Last updated:
apr 23, 2017
Indicators value changes by year
Minimum:
30.591
jan 1, 1976
Maximum:
41.681
jan 1, 2011
At the date of observation
Value
Absolute change
Change from previous value
jan 1, 1975
30.694
+30.694
0.0%
jan 1, 1976
30.591
-0.103
-0.33%
jan 1, 1977
30.844
+0.253
0.83%
jan 1, 1978
31.014
+0.169
0.55%
jan 1, 1979
31.205
+0.191
0.62%
jan 1, 1980
31.438
+0.233
0.75%
jan 1, 1981
31.415
-0.023
-0.07%
jan 1, 1982
31.522
+0.107
0.34%
jan 1, 1983
31.858
+0.336
1.07%
jan 1, 1984
32.033
+0.175
0.55%
jan 1, 1985
32.342
+0.31
0.97%
jan 1, 1986
32.464
+0.121
0.37%
jan 1, 1987
32.374
-0.089
-0.28%
jan 1, 1988
32.418
+0.044
0.14%
jan 1, 1989
32.504
+0.086
0.27%
jan 1, 1990
32.714
+0.21
0.65%
jan 1, 1991
33.005
+0.29
0.89%
jan 1, 1992
33.047
+0.042
0.13%
jan 1, 1993
33.135
+0.088
0.27%
jan 1, 1994
33.262
+0.127
0.38%
jan 1, 1995
33.861
+0.599
1.8%
jan 1, 1996
34.801
+0.939
2.77%
jan 1, 1997
35.56
+0.76
2.18%
jan 1, 1998
36.372
+0.812
2.28%
jan 1, 1999
37.138
+0.766
2.11%
jan 1, 2000
37.917
+0.778
2.1%
jan 1, 2001
38.404
+0.488
1.29%
jan 1, 2002
38.757
+0.353
0.92%
jan 1, 2003
39.136
+0.378
0.98%
jan 1, 2004
38.874
-0.261
-0.67%
jan 1, 2005
39.284
+0.409
1.05%
jan 1, 2006
39.867
+0.584
1.49%
jan 1, 2007
40.268
+0.401
1.01%
jan 1, 2008
40.589
+0.321
0.8%
jan 1, 2009
41.064
+0.475
1.17%
jan 1, 2010
41.567
+0.503
1.23%
jan 1, 2011
41.681
+0.114
0.27%
jan 1, 2012
41.619
-0.062
-0.15%
jan 1, 2013
41.585
-0.034
-0.08%
jan 1, 2014
41.469
-0.116
-0.28%
jan 1, 2015
41.664
+0.195
0.47%
Ranking of countries by current statistics by years


Comments: