29
/
en
AIzaSyAYiBZKx7MnpbEhh9jyipgxe19OcubqV5w
April 1, 2024
26951
Early-demographic dividend
EAR
false
2
1
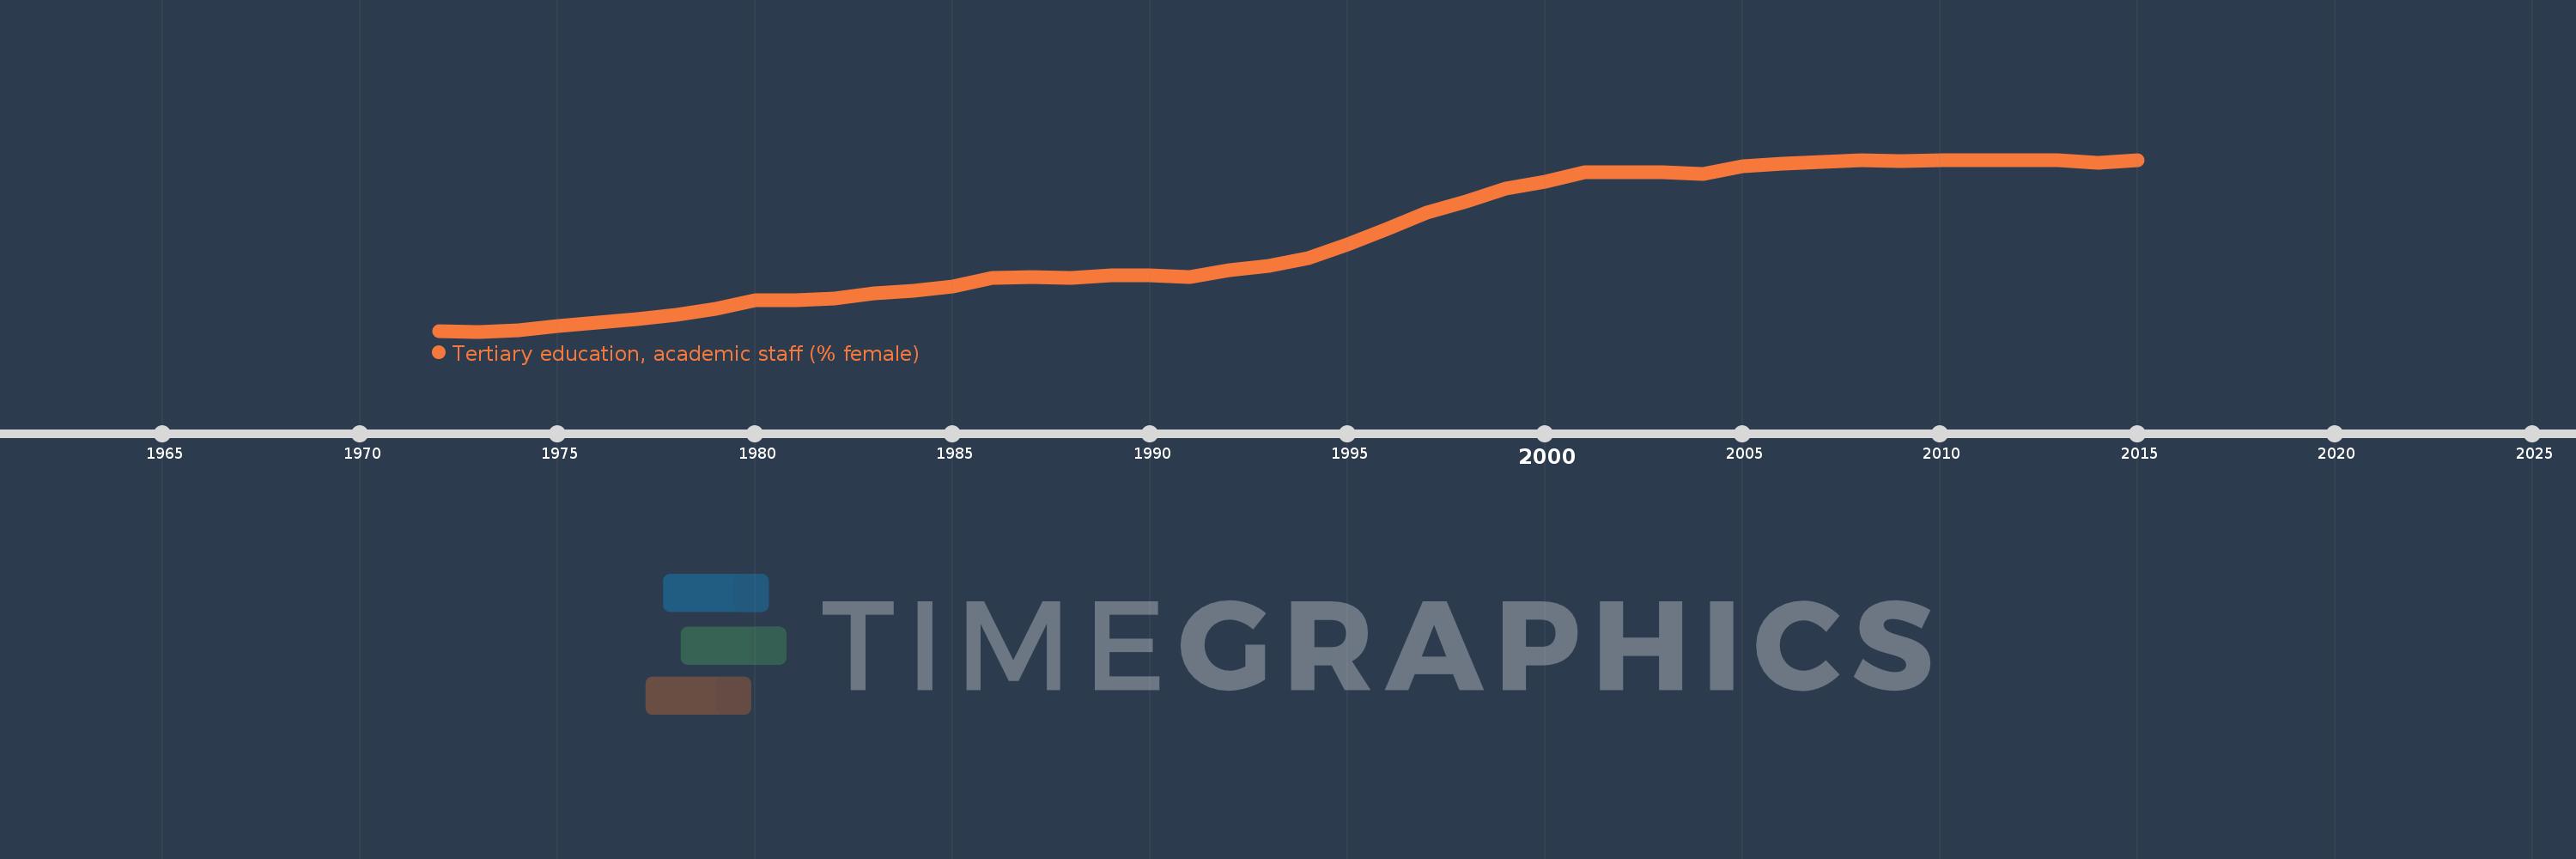
Tertiary education, academic staff (% female)
2015,2014,2013,2012,2011,2010,2009,2008,2007,2006,2005,2004,2003,2002,2001,2000,1999,1998,1997,1996,1995,1994,1993,1992,1991,1990,1989,1988,1987,1986,1985,1984,1983,1982,1981,1980,1979,1978,1977,1976,1975,1974,1973,1972
This statistics in other country:
AfghanistanAlbaniaAlgeriaAndorraAngolaAntigua and BarbudaArab WorldArgentinaArmeniaArubaAustraliaAustriaAzerbaijanBahamas, TheBahrainBangladeshBarbadosBelarusBelgiumBelizeBeninBermudaBhutanBoliviaBosnia and HerzegovinaBotswanaBrazilBritish Virgin IslandsBrunei DarussalamBulgariaBurkina FasoBurundiCabo VerdeCambodiaCameroonCanadaCaribbean small statesCayman IslandsCentral African RepublicCentral Europe and the BalticsChadChileChinaColombiaComorosCongo, Dem. Rep.Congo, Rep.Costa RicaCote d'IvoireCroatiaCubaCyprusCzech RepublicDenmarkDjiboutiDominicaDominican RepublicEarly-demographic dividendEast Asia & PacificEast Asia & Pacific (excluding high income)East Asia & Pacific (IDA & IBRD countries)EcuadorEgypt, Arab Rep.El SalvadorEquatorial GuineaEritreaEstoniaEthiopiaEuro areaEurope & Central AsiaEurope & Central Asia (excluding high income)Europe & Central Asia (IDA & IBRD countries)European UnionFijiFinlandFragile and conflict affected situationsFranceGabonGambia, TheGeorgiaGermanyGhanaGreeceGrenadaGuineaGuyanaHaitiHeavily indebted poor countries (HIPC)High incomeHondurasHong Kong SAR, ChinaHungaryIBRD onlyIcelandIDA & IBRD totalIDA blendIDA onlyIDA totalIndiaIndonesiaIran, Islamic Rep.IraqIrelandItalyJamaicaJapanJordanKazakhstanKorea, Dem. People’s Rep.Korea, Rep.KuwaitKyrgyz RepublicLao PDRLate-demographic dividendLatin America & Caribbean Latin America & Caribbean (excluding high income)Latin America & the Caribbean (IDA & IBRD countries)LatviaLeast developed countries: UN classificationLebanonLesothoLiberiaLibyaLiechtensteinLithuaniaLow & middle incomeLow incomeLower middle incomeLuxembourgMacao SAR, ChinaMacedonia, FYRMadagascarMalawiMalaysiaMaldivesMaliMaltaMarshall IslandsMauritaniaMauritiusMicronesia, Fed. Sts.Middle East & North AfricaMiddle East & North Africa (excluding high income)Middle East & North Africa (IDA & IBRD countries)Middle incomeMoldovaMongoliaMoroccoMozambiqueMyanmarNamibiaNepalNetherlandsNew ZealandNicaraguaNigerNigeriaNorth AmericaNorwayOECD membersOmanOther small statesPacific island small statesPakistanPalauPanamaPapua New GuineaPeruPhilippinesPolandPortugalPost-demographic dividendPre-demographic dividendPuerto RicoQatarRomaniaRussian FederationRwandaSamoaSao Tome and PrincipeSaudi ArabiaSenegalSerbiaSeychellesSierra LeoneSingaporeSint Maarten (Dutch part)Slovak RepublicSloveniaSmall statesSomaliaSouth AfricaSouth AsiaSouth Asia (IDA & IBRD)SpainSri LankaSt. Kitts and NevisSt. LuciaSt. Vincent and the GrenadinesSub-Saharan Africa Sub-Saharan Africa (excluding high income)Sub-Saharan Africa (IDA & IBRD countries)SudanSurinameSwazilandSwedenSwitzerlandSyrian Arab RepublicTajikistanTanzaniaThailandTimor-LesteTogoTongaTrinidad and TobagoTunisiaTurkeyTurkmenistanUgandaUnited Arab EmiratesUnited KingdomUnited StatesUpper middle incomeUruguayUzbekistanVenezuela, RBVietnamWest Bank and GazaWorldYemen, Rep.Zimbabwe Timeline:
This timeline shows a graph from 1972 to 2015 of Early-demographic dividend. No data until 1971. Number of actual observations by date: 44.
Source name:
World Development Indicators
Source organization:
United Nations Educational, Scientific, and Cultural Organization (UNESCO) Institute for Statistics.
Categories, topics:
Education
Last updated:
apr 23, 2017
Indicators value changes by year
Minimum:
23.154
jan 1, 1973
At the date of observation
Value
Absolute change
Change from previous value
jan 1, 1972
23.196
+23.196
0.0%
jan 1, 1973
23.154
-0.042
-0.18%
jan 1, 1974
23.298
+0.143
0.62%
jan 1, 1975
23.621
+0.324
1.39%
jan 1, 1976
23.937
+0.315
1.33%
jan 1, 1977
24.236
+0.299
1.25%
jan 1, 1978
24.636
+0.4
1.65%
jan 1, 1979
25.119
+0.484
1.96%
jan 1, 1980
25.843
+0.724
2.88%
jan 1, 1981
25.861
+0.018
0.07%
jan 1, 1982
26.037
+0.176
0.68%
jan 1, 1983
26.492
+0.455
1.75%
jan 1, 1984
26.704
+0.212
0.8%
jan 1, 1985
27.052
+0.348
1.3%
jan 1, 1986
27.858
+0.807
2.98%
jan 1, 1987
27.895
+0.036
0.13%
jan 1, 1988
27.852
-0.043
-0.15%
jan 1, 1989
28.024
+0.173
0.62%
jan 1, 1990
28.059
+0.035
0.12%
jan 1, 1991
27.897
-0.162
-0.58%
jan 1, 1992
28.518
+0.621
2.23%
jan 1, 1993
28.886
+0.368
1.29%
jan 1, 1994
29.506
+0.62
2.15%
jan 1, 1995
30.751
+1.245
4.22%
jan 1, 1996
32.108
+1.357
4.41%
jan 1, 1997
33.462
+1.354
4.22%
jan 1, 1998
34.472
+1.01
3.02%
jan 1, 1999
35.57
+1.098
3.19%
jan 1, 2000
36.19
+0.62
1.74%
jan 1, 2001
36.989
+0.798
2.21%
jan 1, 2002
37.04
+0.052
0.14%
jan 1, 2003
37.009
-0.031
-0.08%
jan 1, 2004
36.821
-0.188
-0.51%
jan 1, 2005
37.501
+0.68
1.85%
jan 1, 2006
37.734
+0.233
0.62%
jan 1, 2007
37.914
+0.18
0.48%
jan 1, 2008
38.028
+0.114
0.3%
jan 1, 2009
37.994
-0.033
-0.09%
jan 1, 2010
38.028
+0.034
0.09%
jan 1, 2011
38.024
-0.004
-0.01%
jan 1, 2012
38.075
+0.051
0.13%
jan 1, 2013
38.09
+0.015
0.04%
jan 1, 2014
37.843
-0.247
-0.65%
jan 1, 2015
38.072
+0.229
0.61%
Ranking of countries by current statistics by years


Comments: