29
/
en
AIzaSyAYiBZKx7MnpbEhh9jyipgxe19OcubqV5w
April 1, 2024
226471
Portugal
PRT
true
2
1
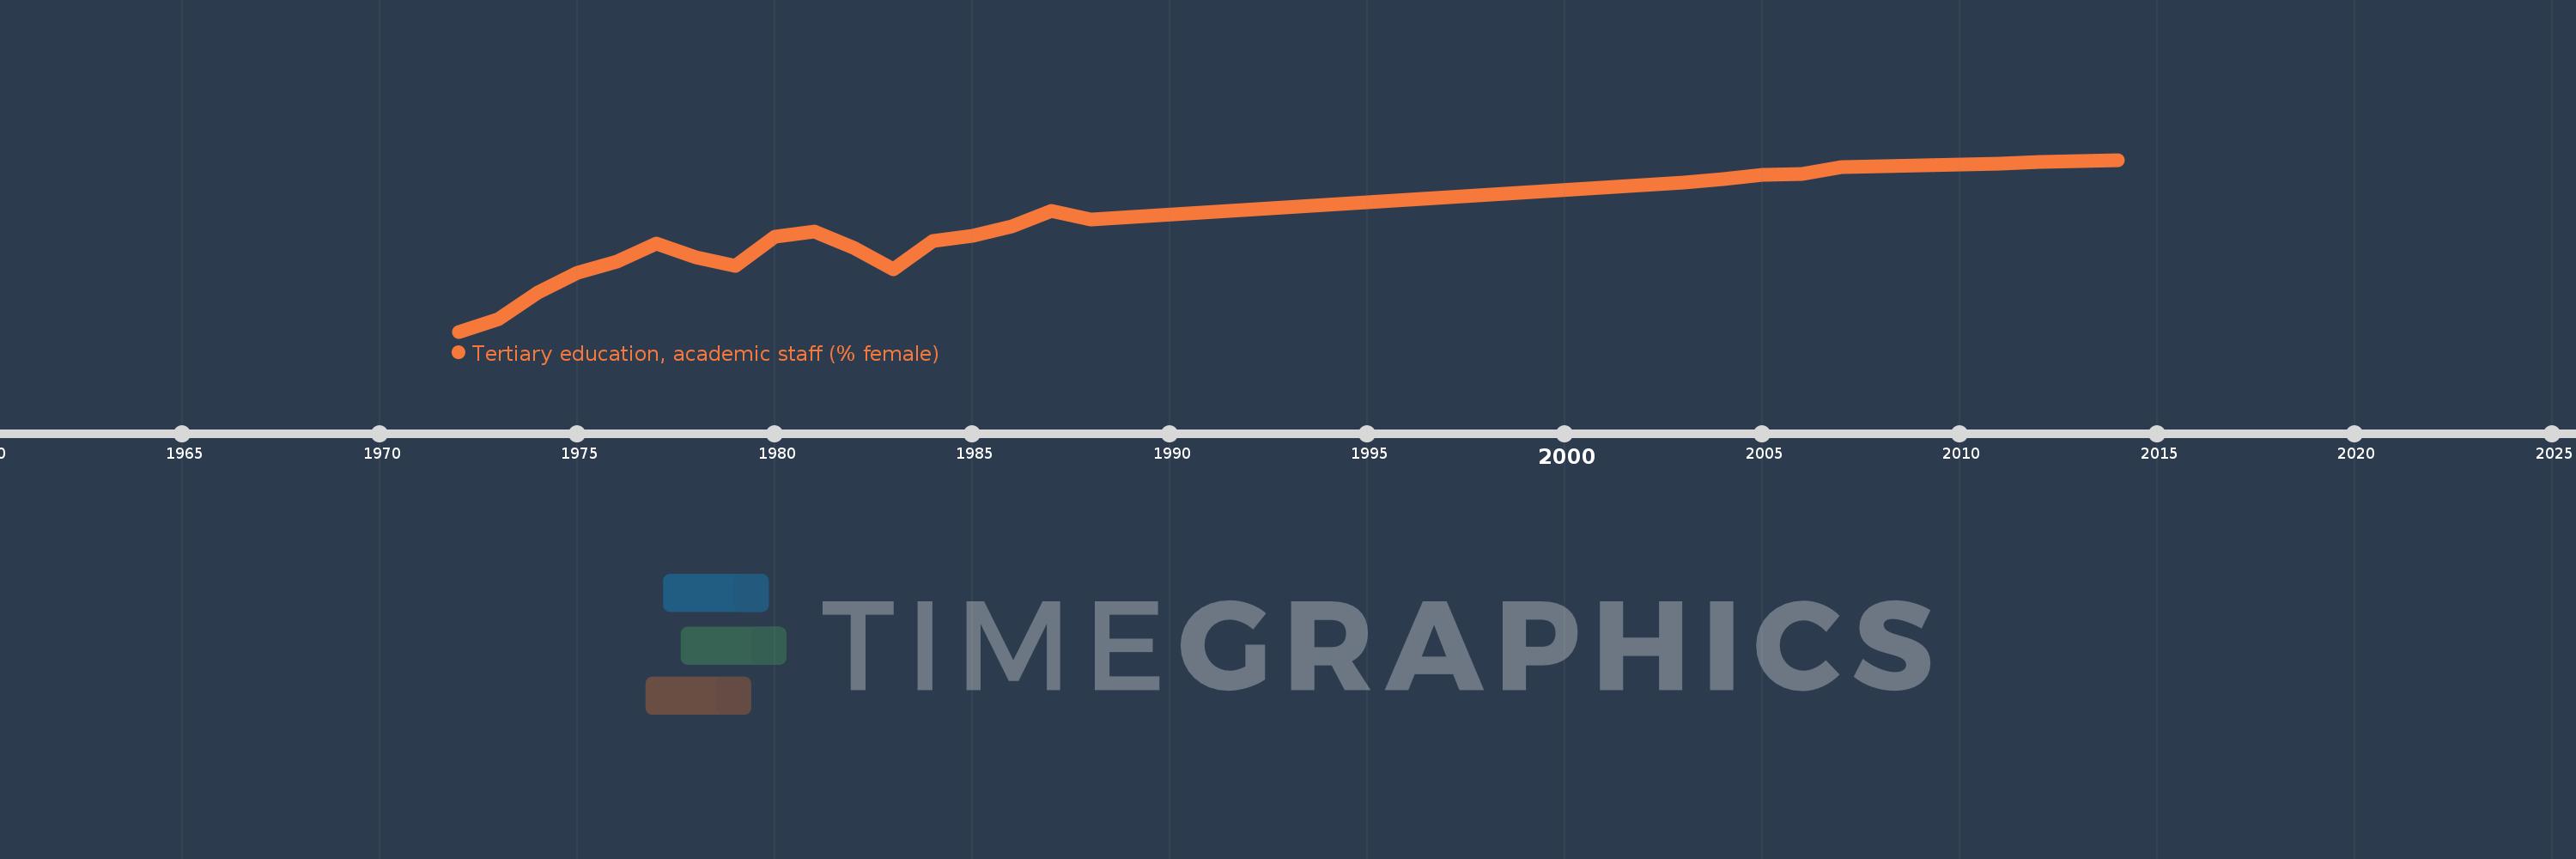
Tertiary education, academic staff (% female)
2014,2013,2012,2011,2010,2009,2008,2007,2006,2005,2004,2003,1988,1987,1986,1985,1984,1983,1982,1981,1980,1979,1978,1977,1976,1975,1974,1973,1972
This statistics in other country:
AfghanistanAlbaniaAlgeriaAndorraAngolaAntigua and BarbudaArab WorldArgentinaArmeniaArubaAustraliaAustriaAzerbaijanBahamas, TheBahrainBangladeshBarbadosBelarusBelgiumBelizeBeninBermudaBhutanBoliviaBosnia and HerzegovinaBotswanaBrazilBritish Virgin IslandsBrunei DarussalamBulgariaBurkina FasoBurundiCabo VerdeCambodiaCameroonCanadaCaribbean small statesCayman IslandsCentral African RepublicCentral Europe and the BalticsChadChileChinaColombiaComorosCongo, Dem. Rep.Congo, Rep.Costa RicaCote d'IvoireCroatiaCubaCyprusCzech RepublicDenmarkDjiboutiDominicaDominican RepublicEarly-demographic dividendEast Asia & PacificEast Asia & Pacific (excluding high income)East Asia & Pacific (IDA & IBRD countries)EcuadorEgypt, Arab Rep.El SalvadorEquatorial GuineaEritreaEstoniaEthiopiaEuro areaEurope & Central AsiaEurope & Central Asia (excluding high income)Europe & Central Asia (IDA & IBRD countries)European UnionFijiFinlandFragile and conflict affected situationsFranceGabonGambia, TheGeorgiaGermanyGhanaGreeceGrenadaGuineaGuyanaHaitiHeavily indebted poor countries (HIPC)High incomeHondurasHong Kong SAR, ChinaHungaryIBRD onlyIcelandIDA & IBRD totalIDA blendIDA onlyIDA totalIndiaIndonesiaIran, Islamic Rep.IraqIrelandItalyJamaicaJapanJordanKazakhstanKorea, Dem. People’s Rep.Korea, Rep.KuwaitKyrgyz RepublicLao PDRLate-demographic dividendLatin America & Caribbean Latin America & Caribbean (excluding high income)Latin America & the Caribbean (IDA & IBRD countries)LatviaLeast developed countries: UN classificationLebanonLesothoLiberiaLibyaLiechtensteinLithuaniaLow & middle incomeLow incomeLower middle incomeLuxembourgMacao SAR, ChinaMacedonia, FYRMadagascarMalawiMalaysiaMaldivesMaliMaltaMarshall IslandsMauritaniaMauritiusMicronesia, Fed. Sts.Middle East & North AfricaMiddle East & North Africa (excluding high income)Middle East & North Africa (IDA & IBRD countries)Middle incomeMoldovaMongoliaMoroccoMozambiqueMyanmarNamibiaNepalNetherlandsNew ZealandNicaraguaNigerNigeriaNorth AmericaNorwayOECD membersOmanOther small statesPacific island small statesPakistanPalauPanamaPapua New GuineaPeruPhilippinesPolandPortugalPost-demographic dividendPre-demographic dividendPuerto RicoQatarRomaniaRussian FederationRwandaSamoaSao Tome and PrincipeSaudi ArabiaSenegalSerbiaSeychellesSierra LeoneSingaporeSint Maarten (Dutch part)Slovak RepublicSloveniaSmall statesSomaliaSouth AfricaSouth AsiaSouth Asia (IDA & IBRD)SpainSri LankaSt. Kitts and NevisSt. LuciaSt. Vincent and the GrenadinesSub-Saharan Africa Sub-Saharan Africa (excluding high income)Sub-Saharan Africa (IDA & IBRD countries)SudanSurinameSwazilandSwedenSwitzerlandSyrian Arab RepublicTajikistanTanzaniaThailandTimor-LesteTogoTongaTrinidad and TobagoTunisiaTurkeyTurkmenistanUgandaUnited Arab EmiratesUnited KingdomUnited StatesUpper middle incomeUruguayUzbekistanVenezuela, RBVietnamWest Bank and GazaWorldYemen, Rep.Zimbabwe Timeline:
This timeline shows a graph from 1972 to 2014 of Portugal. No data until 1971. Number of actual observations by date: 29.
Source name:
World Development Indicators
Source organization:
United Nations Educational, Scientific, and Cultural Organization (UNESCO) Institute for Statistics.
Categories, topics:
Education
Last updated:
apr 23, 2017
Indicators value changes by year
Minimum:
19.414
jan 1, 1972
Maximum:
44.045
jan 1, 2014
At the date of observation
Value
Absolute change
Change from previous value
jan 1, 1972
19.414
+19.414
0.0%
jan 1, 1973
21.173
+1.758
9.06%
jan 1, 1974
25.077
+3.905
18.44%
jan 1, 1975
27.796
+2.719
10.84%
jan 1, 1976
29.399
+1.603
5.77%
jan 1, 1977
32.024
+2.624
8.93%
jan 1, 1978
30.072
-1.952
-6.09%
jan 1, 1979
28.817
-1.255
-4.17%
jan 1, 1980
33.01
+4.192
14.55%
jan 1, 1981
33.759
+0.75
2.27%
jan 1, 1982
31.454
-2.305
-6.83%
jan 1, 1983
28.304
-3.15
-10.02%
jan 1, 1984
32.384
+4.08
14.42%
jan 1, 1985
33.15
+0.766
2.36%
jan 1, 1986
34.51
+1.36
4.1%
jan 1, 1987
36.751
+2.24
6.49%
jan 1, 1988
35.489
-1.262
-3.43%
jan 1, 2003
40.769
+5.281
14.88%
jan 1, 2004
41.228
+0.459
1.13%
jan 1, 2005
41.888
+0.659
1.6%
jan 1, 2006
42.025
+0.138
0.33%
jan 1, 2007
43.044
+1.018
2.42%
jan 1, 2008
43.164
+0.121
0.28%
jan 1, 2009
43.223
+0.059
0.14%
jan 1, 2010
43.426
+0.203
0.47%
jan 1, 2011
43.507
+0.081
0.19%
jan 1, 2012
43.742
+0.235
0.54%
jan 1, 2013
43.805
+0.063
0.14%
jan 1, 2014
44.045
+0.24
0.55%
Ranking of countries by current statistics by years


Comments: