29
/
en
AIzaSyAYiBZKx7MnpbEhh9jyipgxe19OcubqV5w
April 1, 2024
209841
New Zealand
NZL
true
2
1
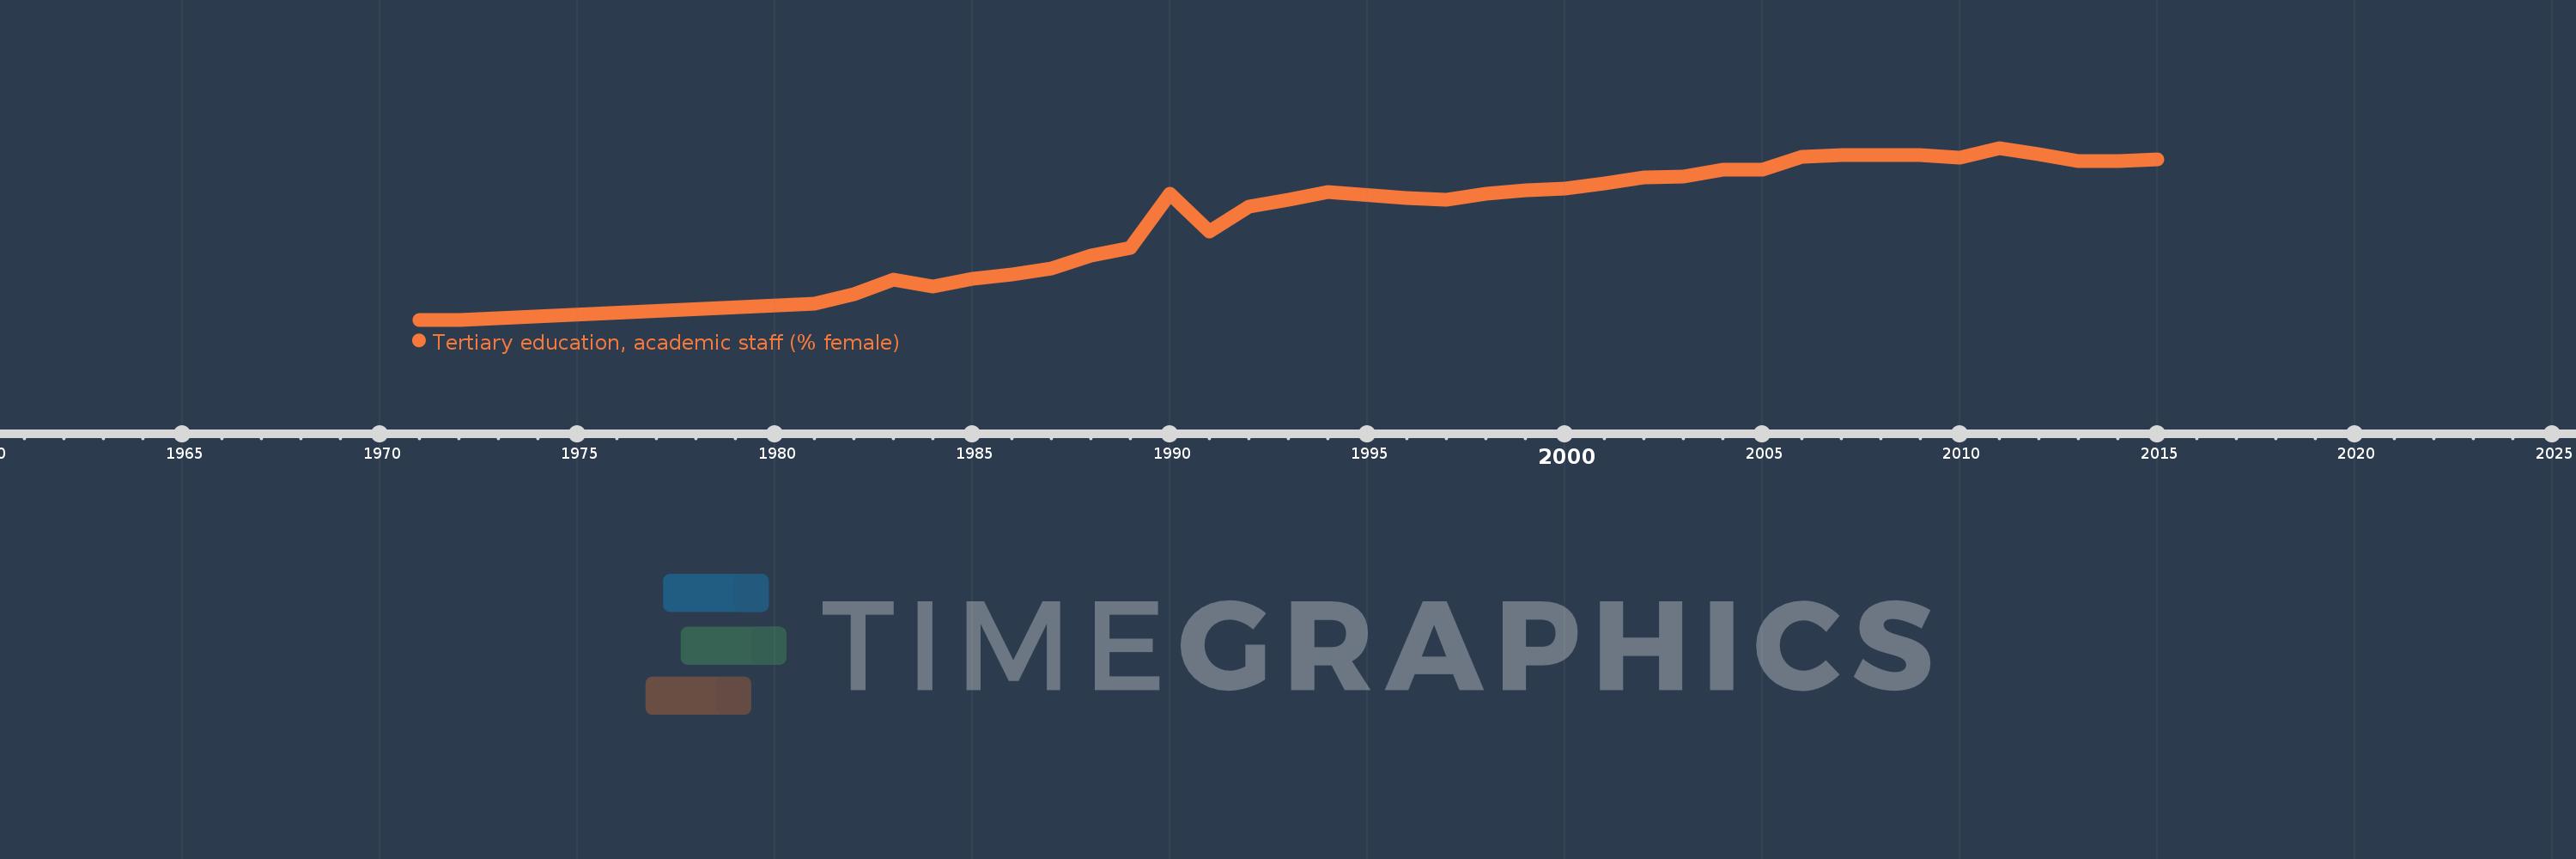
Tertiary education, academic staff (% female)
2015,2014,2013,2012,2011,2010,2009,2008,2007,2006,2005,2004,2003,2002,2001,2000,1999,1998,1997,1996,1994,1993,1992,1991,1990,1989,1988,1987,1986,1985,1984,1983,1982,1981,1972,1971
This statistics in other country:
AfghanistanAlbaniaAlgeriaAndorraAngolaAntigua and BarbudaArab WorldArgentinaArmeniaArubaAustraliaAustriaAzerbaijanBahamas, TheBahrainBangladeshBarbadosBelarusBelgiumBelizeBeninBermudaBhutanBoliviaBosnia and HerzegovinaBotswanaBrazilBritish Virgin IslandsBrunei DarussalamBulgariaBurkina FasoBurundiCabo VerdeCambodiaCameroonCanadaCaribbean small statesCayman IslandsCentral African RepublicCentral Europe and the BalticsChadChileChinaColombiaComorosCongo, Dem. Rep.Congo, Rep.Costa RicaCote d'IvoireCroatiaCubaCyprusCzech RepublicDenmarkDjiboutiDominicaDominican RepublicEarly-demographic dividendEast Asia & PacificEast Asia & Pacific (excluding high income)East Asia & Pacific (IDA & IBRD countries)EcuadorEgypt, Arab Rep.El SalvadorEquatorial GuineaEritreaEstoniaEthiopiaEuro areaEurope & Central AsiaEurope & Central Asia (excluding high income)Europe & Central Asia (IDA & IBRD countries)European UnionFijiFinlandFragile and conflict affected situationsFranceGabonGambia, TheGeorgiaGermanyGhanaGreeceGrenadaGuineaGuyanaHaitiHeavily indebted poor countries (HIPC)High incomeHondurasHong Kong SAR, ChinaHungaryIBRD onlyIcelandIDA & IBRD totalIDA blendIDA onlyIDA totalIndiaIndonesiaIran, Islamic Rep.IraqIrelandItalyJamaicaJapanJordanKazakhstanKorea, Dem. People’s Rep.Korea, Rep.KuwaitKyrgyz RepublicLao PDRLate-demographic dividendLatin America & Caribbean Latin America & Caribbean (excluding high income)Latin America & the Caribbean (IDA & IBRD countries)LatviaLeast developed countries: UN classificationLebanonLesothoLiberiaLibyaLiechtensteinLithuaniaLow & middle incomeLow incomeLower middle incomeLuxembourgMacao SAR, ChinaMacedonia, FYRMadagascarMalawiMalaysiaMaldivesMaliMaltaMarshall IslandsMauritaniaMauritiusMicronesia, Fed. Sts.Middle East & North AfricaMiddle East & North Africa (excluding high income)Middle East & North Africa (IDA & IBRD countries)Middle incomeMoldovaMongoliaMoroccoMozambiqueMyanmarNamibiaNepalNetherlandsNew ZealandNicaraguaNigerNigeriaNorth AmericaNorwayOECD membersOmanOther small statesPacific island small statesPakistanPalauPanamaPapua New GuineaPeruPhilippinesPolandPortugalPost-demographic dividendPre-demographic dividendPuerto RicoQatarRomaniaRussian FederationRwandaSamoaSao Tome and PrincipeSaudi ArabiaSenegalSerbiaSeychellesSierra LeoneSingaporeSint Maarten (Dutch part)Slovak RepublicSloveniaSmall statesSomaliaSouth AfricaSouth AsiaSouth Asia (IDA & IBRD)SpainSri LankaSt. Kitts and NevisSt. LuciaSt. Vincent and the GrenadinesSub-Saharan Africa Sub-Saharan Africa (excluding high income)Sub-Saharan Africa (IDA & IBRD countries)SudanSurinameSwazilandSwedenSwitzerlandSyrian Arab RepublicTajikistanTanzaniaThailandTimor-LesteTogoTongaTrinidad and TobagoTunisiaTurkeyTurkmenistanUgandaUnited Arab EmiratesUnited KingdomUnited StatesUpper middle incomeUruguayUzbekistanVenezuela, RBVietnamWest Bank and GazaWorldYemen, Rep.Zimbabwe Timeline:
This timeline shows a graph from 1971 to 2015 of New Zealand. No data until 1970. Number of actual observations by date: 36.
Source name:
World Development Indicators
Source organization:
United Nations Educational, Scientific, and Cultural Organization (UNESCO) Institute for Statistics.
Categories, topics:
Education
Last updated:
apr 23, 2017
Indicators value changes by year
Minimum:
14.528
jan 1, 1971
At the date of observation
Value
Absolute change
Change from previous value
jan 1, 1971
14.528
+14.528
0.0%
jan 1, 1972
14.546
+0.018
0.13%
jan 1, 1981
17.897
+3.351
23.04%
jan 1, 1982
19.927
+2.03
11.34%
jan 1, 1983
23.165
+3.238
16.25%
jan 1, 1984
21.743
-1.422
-6.14%
jan 1, 1985
23.402
+1.659
7.63%
jan 1, 1986
24.265
+0.863
3.69%
jan 1, 1987
25.585
+1.32
5.44%
jan 1, 1988
28.288
+2.703
10.57%
jan 1, 1989
30.026
+1.738
6.14%
jan 1, 1990
41.55
+11.523
38.38%
jan 1, 1991
33.569
-7.98
-19.21%
jan 1, 1992
38.783
+5.214
15.53%
jan 1, 1993
40.261
+1.478
3.81%
jan 1, 1994
41.957
+1.696
4.21%
jan 1, 1996
40.753
-1.204
-2.87%
jan 1, 1997
40.38
-0.373
-0.92%
jan 1, 1998
41.697
+1.316
3.26%
jan 1, 1999
42.424
+0.727
1.74%
jan 1, 2000
42.791
+0.367
0.86%
jan 1, 2001
43.841
+1.05
2.45%
jan 1, 2002
45.166
+1.325
3.02%
jan 1, 2003
45.374
+0.209
0.46%
jan 1, 2004
46.797
+1.422
3.13%
jan 1, 2005
46.754
-0.043
-0.09%
jan 1, 2006
49.645
+2.891
6.18%
jan 1, 2007
49.873
+0.229
0.46%
jan 1, 2008
49.915
+0.041
0.08%
jan 1, 2009
49.96
+0.045
0.09%
jan 1, 2010
49.461
-0.499
-1.0%
jan 1, 2011
51.49
+2.029
4.1%
jan 1, 2012
50.05
-1.44
-2.8%
jan 1, 2013
48.721
-1.329
-2.66%
jan 1, 2014
48.702
-0.019
-0.04%
jan 1, 2015
49.062
+0.36
0.74%
Ranking of countries by current statistics by years


Comments: