29
/
en
AIzaSyAYiBZKx7MnpbEhh9jyipgxe19OcubqV5w
April 1, 2024
56654
Small states
SST
false
2
1
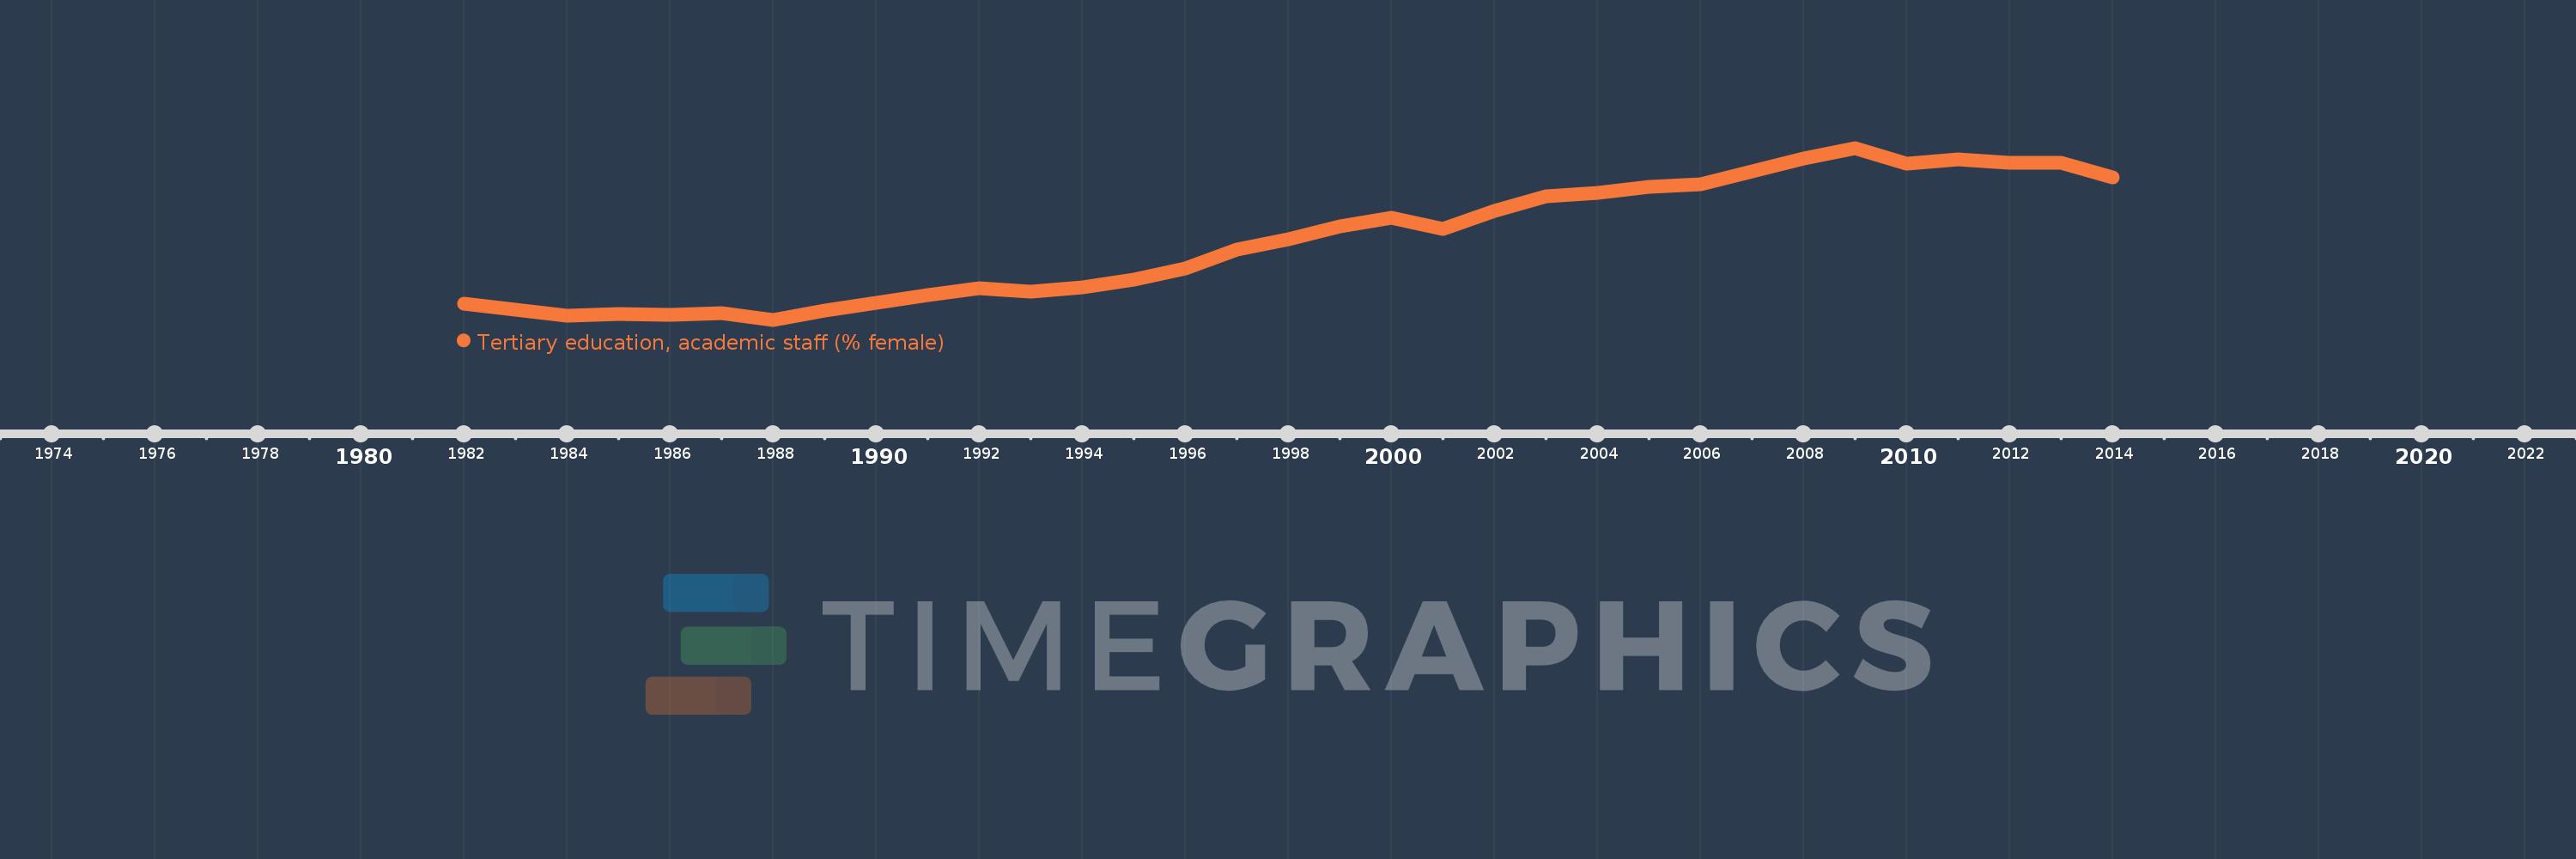
Tertiary education, academic staff (% female)
2014,2013,2012,2011,2010,2009,2008,2007,2006,2005,2004,2003,2002,2001,2000,1999,1998,1997,1996,1995,1994,1993,1992,1991,1990,1989,1988,1987,1986,1985,1984,1983,1982
This statistics in other country:
AfghanistanAlbaniaAlgeriaAndorraAngolaAntigua and BarbudaArab WorldArgentinaArmeniaArubaAustraliaAustriaAzerbaijanBahamas, TheBahrainBangladeshBarbadosBelarusBelgiumBelizeBeninBermudaBhutanBoliviaBosnia and HerzegovinaBotswanaBrazilBritish Virgin IslandsBrunei DarussalamBulgariaBurkina FasoBurundiCabo VerdeCambodiaCameroonCanadaCaribbean small statesCayman IslandsCentral African RepublicCentral Europe and the BalticsChadChileChinaColombiaComorosCongo, Dem. Rep.Congo, Rep.Costa RicaCote d'IvoireCroatiaCubaCyprusCzech RepublicDenmarkDjiboutiDominicaDominican RepublicEarly-demographic dividendEast Asia & PacificEast Asia & Pacific (excluding high income)East Asia & Pacific (IDA & IBRD countries)EcuadorEgypt, Arab Rep.El SalvadorEquatorial GuineaEritreaEstoniaEthiopiaEuro areaEurope & Central AsiaEurope & Central Asia (excluding high income)Europe & Central Asia (IDA & IBRD countries)European UnionFijiFinlandFragile and conflict affected situationsFranceGabonGambia, TheGeorgiaGermanyGhanaGreeceGrenadaGuineaGuyanaHaitiHeavily indebted poor countries (HIPC)High incomeHondurasHong Kong SAR, ChinaHungaryIBRD onlyIcelandIDA & IBRD totalIDA blendIDA onlyIDA totalIndiaIndonesiaIran, Islamic Rep.IraqIrelandItalyJamaicaJapanJordanKazakhstanKorea, Dem. People’s Rep.Korea, Rep.KuwaitKyrgyz RepublicLao PDRLate-demographic dividendLatin America & Caribbean Latin America & Caribbean (excluding high income)Latin America & the Caribbean (IDA & IBRD countries)LatviaLeast developed countries: UN classificationLebanonLesothoLiberiaLibyaLiechtensteinLithuaniaLow & middle incomeLow incomeLower middle incomeLuxembourgMacao SAR, ChinaMacedonia, FYRMadagascarMalawiMalaysiaMaldivesMaliMaltaMarshall IslandsMauritaniaMauritiusMicronesia, Fed. Sts.Middle East & North AfricaMiddle East & North Africa (excluding high income)Middle East & North Africa (IDA & IBRD countries)Middle incomeMoldovaMongoliaMoroccoMozambiqueMyanmarNamibiaNepalNetherlandsNew ZealandNicaraguaNigerNigeriaNorth AmericaNorwayOECD membersOmanOther small statesPacific island small statesPakistanPalauPanamaPapua New GuineaPeruPhilippinesPolandPortugalPost-demographic dividendPre-demographic dividendPuerto RicoQatarRomaniaRussian FederationRwandaSamoaSao Tome and PrincipeSaudi ArabiaSenegalSerbiaSeychellesSierra LeoneSingaporeSint Maarten (Dutch part)Slovak RepublicSloveniaSmall statesSomaliaSouth AfricaSouth AsiaSouth Asia (IDA & IBRD)SpainSri LankaSt. Kitts and NevisSt. LuciaSt. Vincent and the GrenadinesSub-Saharan Africa Sub-Saharan Africa (excluding high income)Sub-Saharan Africa (IDA & IBRD countries)SudanSurinameSwazilandSwedenSwitzerlandSyrian Arab RepublicTajikistanTanzaniaThailandTimor-LesteTogoTongaTrinidad and TobagoTunisiaTurkeyTurkmenistanUgandaUnited Arab EmiratesUnited KingdomUnited StatesUpper middle incomeUruguayUzbekistanVenezuela, RBVietnamWest Bank and GazaWorldYemen, Rep.Zimbabwe Timeline:
This timeline shows a graph from 1982 to 2014 of Small states. No data until 1981. Number of actual observations by date: 33.
Source name:
World Development Indicators
Source organization:
United Nations Educational, Scientific, and Cultural Organization (UNESCO) Institute for Statistics.
Categories, topics:
Education
Last updated:
apr 23, 2017
Indicators value changes by year
Maximum:
42.807
jan 1, 2009
At the date of observation
Value
Absolute change
Change from previous value
jan 1, 1982
35.52
+35.52
0.0%
jan 1, 1983
35.272
-0.248
-0.7%
jan 1, 1984
34.998
-0.274
-0.78%
jan 1, 1985
35.056
+0.057
0.16%
jan 1, 1986
34.999
-0.057
-0.16%
jan 1, 1987
35.098
+0.099
0.28%
jan 1, 1988
34.79
-0.308
-0.88%
jan 1, 1989
35.199
+0.409
1.18%
jan 1, 1990
35.569
+0.37
1.05%
jan 1, 1991
35.936
+0.366
1.03%
jan 1, 1992
36.279
+0.343
0.96%
jan 1, 1993
36.102
-0.177
-0.49%
jan 1, 1994
36.287
+0.185
0.51%
jan 1, 1995
36.648
+0.361
1.0%
jan 1, 1996
37.166
+0.518
1.41%
jan 1, 1997
38.078
+0.912
2.45%
jan 1, 1998
38.547
+0.469
1.23%
jan 1, 1999
39.138
+0.591
1.53%
jan 1, 2000
39.546
+0.408
1.04%
jan 1, 2001
39.044
-0.501
-1.27%
jan 1, 2002
39.881
+0.837
2.14%
jan 1, 2003
40.546
+0.665
1.67%
jan 1, 2004
40.702
+0.155
0.38%
jan 1, 2005
40.991
+0.289
0.71%
jan 1, 2006
41.131
+0.14
0.34%
jan 1, 2007
41.718
+0.588
1.43%
jan 1, 2008
42.331
+0.613
1.47%
jan 1, 2009
42.807
+0.476
1.12%
jan 1, 2010
42.054
-0.752
-1.76%
jan 1, 2011
42.275
+0.221
0.52%
jan 1, 2012
42.125
-0.15
-0.35%
jan 1, 2013
42.11
-0.015
-0.04%
jan 1, 2014
41.415
-0.694
-1.65%
Ranking of countries by current statistics by years


Comments: