29
/
en
AIzaSyAYiBZKx7MnpbEhh9jyipgxe19OcubqV5w
April 1, 2024
58586
South Asia (IDA & IBRD)
TSA
false
2
1
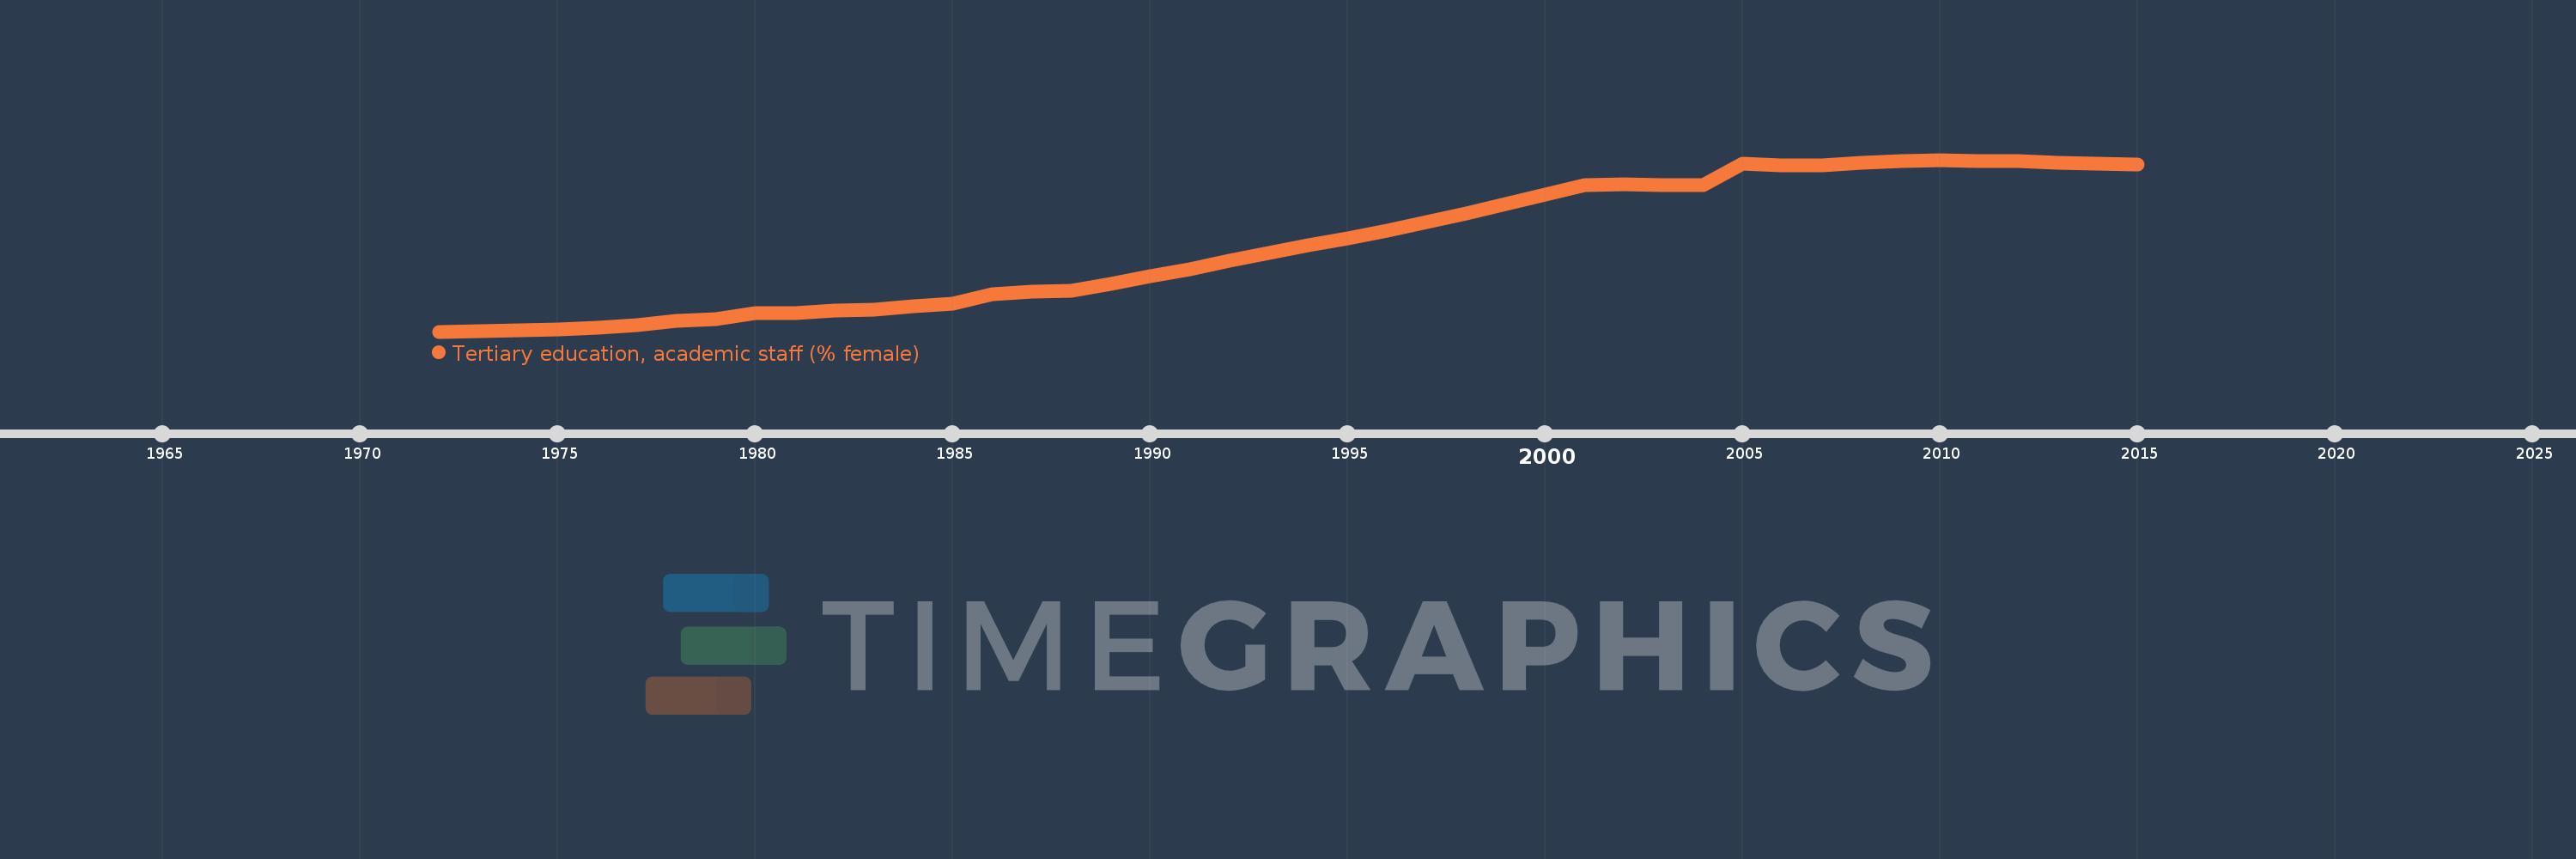
Tertiary education, academic staff (% female)
2015,2014,2013,2012,2011,2010,2009,2008,2007,2006,2005,2004,2003,2002,2001,2000,1999,1998,1997,1996,1995,1994,1993,1992,1991,1990,1989,1988,1987,1986,1985,1984,1983,1982,1981,1980,1979,1978,1977,1976,1975,1974,1973,1972
This statistics in other country:
AfghanistanAlbaniaAlgeriaAndorraAngolaAntigua and BarbudaArab WorldArgentinaArmeniaArubaAustraliaAustriaAzerbaijanBahamas, TheBahrainBangladeshBarbadosBelarusBelgiumBelizeBeninBermudaBhutanBoliviaBosnia and HerzegovinaBotswanaBrazilBritish Virgin IslandsBrunei DarussalamBulgariaBurkina FasoBurundiCabo VerdeCambodiaCameroonCanadaCaribbean small statesCayman IslandsCentral African RepublicCentral Europe and the BalticsChadChileChinaColombiaComorosCongo, Dem. Rep.Congo, Rep.Costa RicaCote d'IvoireCroatiaCubaCyprusCzech RepublicDenmarkDjiboutiDominicaDominican RepublicEarly-demographic dividendEast Asia & PacificEast Asia & Pacific (excluding high income)East Asia & Pacific (IDA & IBRD countries)EcuadorEgypt, Arab Rep.El SalvadorEquatorial GuineaEritreaEstoniaEthiopiaEuro areaEurope & Central AsiaEurope & Central Asia (excluding high income)Europe & Central Asia (IDA & IBRD countries)European UnionFijiFinlandFragile and conflict affected situationsFranceGabonGambia, TheGeorgiaGermanyGhanaGreeceGrenadaGuineaGuyanaHaitiHeavily indebted poor countries (HIPC)High incomeHondurasHong Kong SAR, ChinaHungaryIBRD onlyIcelandIDA & IBRD totalIDA blendIDA onlyIDA totalIndiaIndonesiaIran, Islamic Rep.IraqIrelandItalyJamaicaJapanJordanKazakhstanKorea, Dem. People’s Rep.Korea, Rep.KuwaitKyrgyz RepublicLao PDRLate-demographic dividendLatin America & Caribbean Latin America & Caribbean (excluding high income)Latin America & the Caribbean (IDA & IBRD countries)LatviaLeast developed countries: UN classificationLebanonLesothoLiberiaLibyaLiechtensteinLithuaniaLow & middle incomeLow incomeLower middle incomeLuxembourgMacao SAR, ChinaMacedonia, FYRMadagascarMalawiMalaysiaMaldivesMaliMaltaMarshall IslandsMauritaniaMauritiusMicronesia, Fed. Sts.Middle East & North AfricaMiddle East & North Africa (excluding high income)Middle East & North Africa (IDA & IBRD countries)Middle incomeMoldovaMongoliaMoroccoMozambiqueMyanmarNamibiaNepalNetherlandsNew ZealandNicaraguaNigerNigeriaNorth AmericaNorwayOECD membersOmanOther small statesPacific island small statesPakistanPalauPanamaPapua New GuineaPeruPhilippinesPolandPortugalPost-demographic dividendPre-demographic dividendPuerto RicoQatarRomaniaRussian FederationRwandaSamoaSao Tome and PrincipeSaudi ArabiaSenegalSerbiaSeychellesSierra LeoneSingaporeSint Maarten (Dutch part)Slovak RepublicSloveniaSmall statesSomaliaSouth AfricaSouth AsiaSouth Asia (IDA & IBRD)SpainSri LankaSt. Kitts and NevisSt. LuciaSt. Vincent and the GrenadinesSub-Saharan Africa Sub-Saharan Africa (excluding high income)Sub-Saharan Africa (IDA & IBRD countries)SudanSurinameSwazilandSwedenSwitzerlandSyrian Arab RepublicTajikistanTanzaniaThailandTimor-LesteTogoTongaTrinidad and TobagoTunisiaTurkeyTurkmenistanUgandaUnited Arab EmiratesUnited KingdomUnited StatesUpper middle incomeUruguayUzbekistanVenezuela, RBVietnamWest Bank and GazaWorldYemen, Rep.Zimbabwe Timeline:
This timeline shows a graph from 1972 to 2015 of South Asia (IDA & IBRD). No data until 1971. Number of actual observations by date: 44.
Source name:
World Development Indicators
Source organization:
United Nations Educational, Scientific, and Cultural Organization (UNESCO) Institute for Statistics.
Categories, topics:
Education
Last updated:
apr 23, 2017
Indicators value changes by year
Minimum:
15.376
jan 1, 1972
Maximum:
38.008
jan 1, 2010
At the date of observation
Value
Absolute change
Change from previous value
jan 1, 1972
15.376
+15.376
0.0%
jan 1, 1973
15.404
+0.027
0.18%
jan 1, 1974
15.537
+0.133
0.86%
jan 1, 1975
15.662
+0.125
0.8%
jan 1, 1976
15.888
+0.226
1.44%
jan 1, 1977
16.231
+0.343
2.16%
jan 1, 1978
16.791
+0.559
3.45%
jan 1, 1979
17.041
+0.251
1.49%
jan 1, 1980
17.764
+0.723
4.24%
jan 1, 1981
17.765
+0.001
0.0%
jan 1, 1982
18.14
+0.375
2.11%
jan 1, 1983
18.29
+0.149
0.82%
jan 1, 1984
18.706
+0.416
2.28%
jan 1, 1985
19.049
+0.344
1.84%
jan 1, 1986
20.285
+1.236
6.49%
jan 1, 1987
20.649
+0.364
1.79%
jan 1, 1988
20.711
+0.062
0.3%
jan 1, 1989
21.615
+0.904
4.36%
jan 1, 1990
22.643
+1.029
4.76%
jan 1, 1991
23.593
+0.949
4.19%
jan 1, 1992
24.656
+1.064
4.51%
jan 1, 1993
25.708
+1.051
4.26%
jan 1, 1994
26.716
+1.008
3.92%
jan 1, 1995
27.704
+0.989
3.7%
jan 1, 1996
28.669
+0.965
3.48%
jan 1, 1997
29.86
+1.191
4.15%
jan 1, 1998
30.924
+1.064
3.56%
jan 1, 1999
32.206
+1.282
4.15%
jan 1, 2000
33.46
+1.254
3.89%
jan 1, 2001
34.702
+1.241
3.71%
jan 1, 2002
34.727
+0.025
0.07%
jan 1, 2003
34.69
-0.037
-0.11%
jan 1, 2004
34.622
-0.068
-0.2%
jan 1, 2005
37.539
+2.917
8.43%
jan 1, 2006
37.312
-0.227
-0.6%
jan 1, 2007
37.32
+0.009
0.02%
jan 1, 2008
37.598
+0.277
0.74%
jan 1, 2009
37.892
+0.295
0.78%
jan 1, 2010
38.008
+0.115
0.3%
jan 1, 2011
37.798
-0.21
-0.55%
jan 1, 2012
37.809
+0.011
0.03%
jan 1, 2013
37.623
-0.186
-0.49%
jan 1, 2014
37.466
-0.157
-0.42%
jan 1, 2015
37.408
-0.058
-0.15%
Ranking of countries by current statistics by years


Comments: