29
/
en
AIzaSyAYiBZKx7MnpbEhh9jyipgxe19OcubqV5w
April 1, 2024
62369
World
WLD
false
2
1
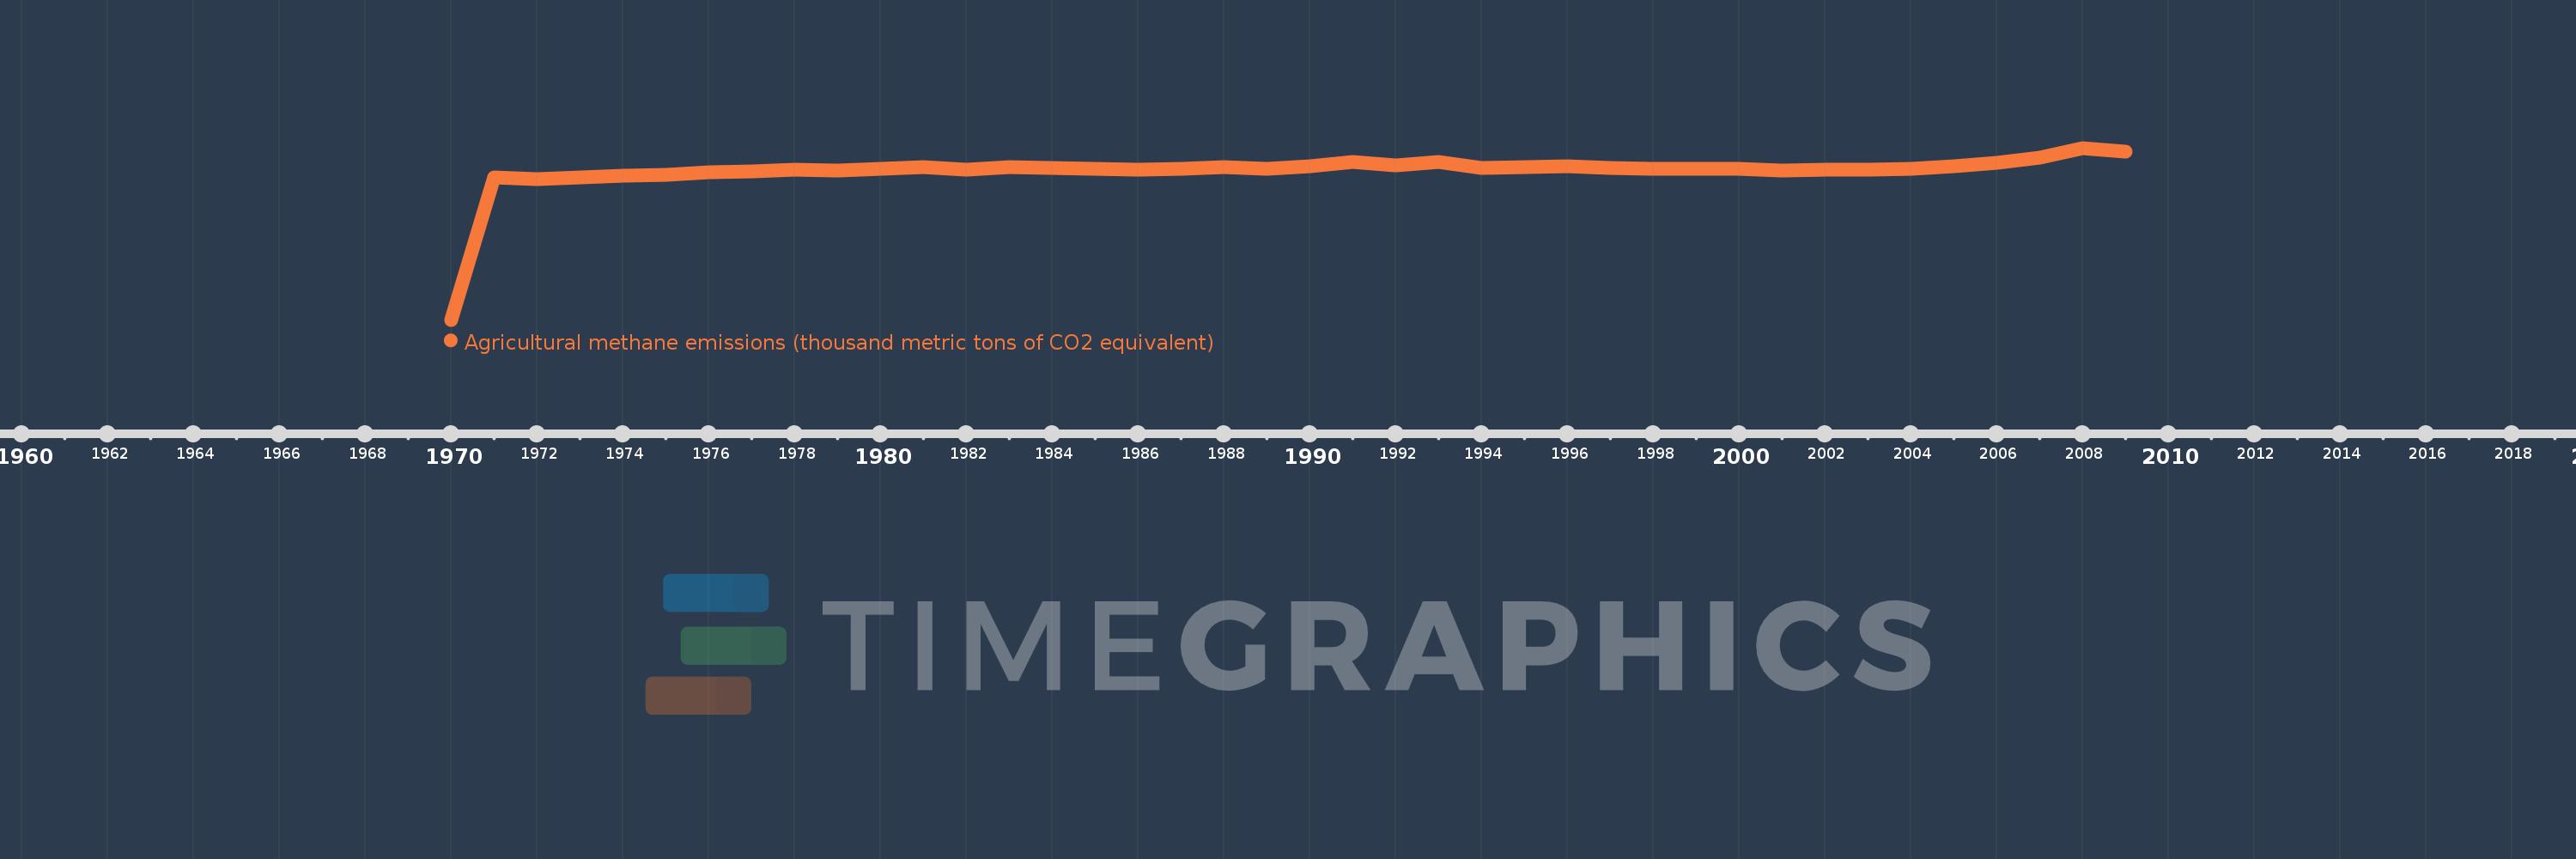
Agricultural methane emissions (thousand metric tons of CO2 equivalent)
2009,2008,2007,2006,2005,2004,2003,2002,2001,2000,1999,1998,1997,1996,1995,1994,1993,1992,1991,1990,1989,1988,1987,1986,1985,1984,1983,1982,1981,1980,1979,1978,1977,1976,1975,1974,1973,1972,1971,1970
This statistics in other country:
AfghanistanAlbaniaAlgeriaAmerican SamoaAndorraAngolaAntigua and BarbudaArab WorldArgentinaArmeniaArubaAustraliaAustriaAzerbaijanBahamas, TheBahrainBangladeshBarbadosBelarusBelgiumBelizeBeninBermudaBhutanBoliviaBosnia and HerzegovinaBotswanaBrazilBritish Virgin IslandsBrunei DarussalamBulgariaBurkina FasoBurundiCabo VerdeCambodiaCameroonCanadaCaribbean small statesCayman IslandsCentral African RepublicCentral Europe and the BalticsChadChannel IslandsChileChinaColombiaComorosCongo, Dem. Rep.Congo, Rep.Costa RicaCote d'IvoireCroatiaCubaCuracaoCyprusCzech RepublicDenmarkDjiboutiDominicaDominican RepublicEarly-demographic dividendEast Asia & PacificEast Asia & Pacific (excluding high income)East Asia & Pacific (IDA & IBRD countries)EcuadorEgypt, Arab Rep.El SalvadorEquatorial GuineaEritreaEstoniaEthiopiaEuro areaEurope & Central AsiaEurope & Central Asia (excluding high income)Europe & Central Asia (IDA & IBRD countries)European UnionFaroe IslandsFijiFinlandFragile and conflict affected situationsFranceFrench PolynesiaGabonGambia, TheGeorgiaGermanyGhanaGibraltarGreeceGreenlandGrenadaGuamGuatemalaGuineaGuinea-BissauGuyanaHaitiHeavily indebted poor countries (HIPC)High incomeHondurasHong Kong SAR, ChinaHungaryIBRD onlyIcelandIDA & IBRD totalIDA blendIDA onlyIDA totalIndiaIndonesiaIran, Islamic Rep.IraqIrelandIsle of ManIsraelItalyJamaicaJapanJordanKazakhstanKenyaKiribatiKorea, Dem. People’s Rep.Korea, Rep.KosovoKuwaitKyrgyz RepublicLao PDRLate-demographic dividendLatin America & Caribbean Latin America & Caribbean (excluding high income)Latin America & the Caribbean (IDA & IBRD countries)LatviaLeast developed countries: UN classificationLebanonLesothoLiberiaLibyaLiechtensteinLithuaniaLow & middle incomeLow incomeLower middle incomeLuxembourgMacao SAR, ChinaMacedonia, FYRMadagascarMalawiMalaysiaMaldivesMaliMaltaMarshall IslandsMauritaniaMauritiusMexicoMicronesia, Fed. Sts.Middle East & North AfricaMiddle East & North Africa (excluding high income)Middle East & North Africa (IDA & IBRD countries)Middle incomeMoldovaMonacoMongoliaMontenegroMoroccoMozambiqueMyanmarNamibiaNauruNepalNetherlandsNew CaledoniaNew ZealandNicaraguaNigerNigeriaNorth AmericaNorthern Mariana IslandsNorwayOECD membersOmanOther small statesPacific island small statesPakistanPalauPanamaPapua New GuineaParaguayPeruPhilippinesPolandPortugalPost-demographic dividendPre-demographic dividendPuerto RicoQatarRomaniaRussian FederationRwandaSamoaSan MarinoSao Tome and PrincipeSaudi ArabiaSenegalSerbiaSeychellesSierra LeoneSingaporeSint Maarten (Dutch part)Slovak RepublicSloveniaSmall statesSolomon IslandsSomaliaSouth AfricaSouth AsiaSouth Asia (IDA & IBRD)South SudanSpainSri LankaSt. Kitts and NevisSt. LuciaSt. Martin (French part)St. Vincent and the GrenadinesSub-Saharan Africa Sub-Saharan Africa (excluding high income)Sub-Saharan Africa (IDA & IBRD countries)SudanSurinameSwazilandSwedenSwitzerlandSyrian Arab RepublicTajikistanTanzaniaThailandTimor-LesteTogoTongaTrinidad and TobagoTunisiaTurkeyTurkmenistanTurks and Caicos IslandsTuvaluUgandaUkraineUnited Arab EmiratesUnited KingdomUnited StatesUpper middle incomeUruguayUzbekistanVanuatuVenezuela, RBVietnamVirgin Islands (U.S.)West Bank and GazaWorldYemen, Rep.ZambiaZimbabwe Timeline:
This timeline shows a graph from 1970 to 2009 of World. No data until 1969. Number of actual observations by date: 40.
Source name:
World Development Indicators
Source organization:
European Commission, Joint Research Centre (JRC)/Netherlands Environmental Assessment Agency (PBL). Emission Database for Global Atmospheric Research (EDGAR): http://edgar.jrc.ec.europa.eu/
Categories, topics:
Agriculture & Rural Development, Environment
Last updated:
apr 23, 2017
Indicators value changes by year
Maximum:
3.464 mln
jan 1, 2008
At the date of observation
Value
Absolute change
Change from previous value
jan 1, 1971
2.875 mln
+2.875 mln
%
jan 1, 1972
2.841 mln
-33.687K
-1.17%
jan 1, 1973
2.872 mln
+30.601K
1.08%
jan 1, 1974
2.912 mln
+40.382K
1.41%
jan 1, 1975
2.915 mln
+3.453K
0.12%
jan 1, 1976
2.98 mln
+64.224K
2.2%
jan 1, 1977
2.993 mln
+12.918K
0.43%
jan 1, 1978
3.023 mln
+29.997K
1.0%
jan 1, 1979
3.003 mln
-19.712K
-0.65%
jan 1, 1980
3.039 mln
+36.654K
1.22%
jan 1, 1981
3.073 mln
+33.117K
1.09%
jan 1, 1982
3.028 mln
-44.702K
-1.45%
jan 1, 1983
3.071 mln
+43.56K
1.44%
jan 1, 1984
3.063 mln
-8.852K
-0.29%
jan 1, 1985
3.035 mln
-27.376K
-0.89%
jan 1, 1986
3.027 mln
-8.604K
-0.28%
jan 1, 1987
3.044 mln
+17.142K
0.57%
jan 1, 1988
3.073 mln
+29.668K
0.97%
jan 1, 1989
3.045 mln
-28.777K
-0.94%
jan 1, 1990
3.102 mln
+57.406K
1.89%
jan 1, 1991
3.179 mln
+77.395K
2.49%
jan 1, 1992
3.113 mln
-66.308K
-2.09%
jan 1, 1993
3.182 mln
+68.953K
2.21%
jan 1, 1994
3.059 mln
-122.819K
-3.86%
jan 1, 1995
3.08 mln
+21.056K
0.69%
jan 1, 1996
3.098 mln
+17.531K
0.57%
jan 1, 1997
3.063 mln
-35.219K
-1.14%
jan 1, 1998
3.04 mln
-22.492K
-0.73%
jan 1, 1999
3.045 mln
+4.465K
0.15%
jan 1, 2000
3.037 mln
-8.068K
-0.26%
jan 1, 2001
3.004 mln
-32.878K
-1.08%
jan 1, 2002
3.019 mln
+15.629K
0.52%
jan 1, 2003
3.024 mln
+4.822K
0.16%
jan 1, 2004
3.039 mln
+14.735K
0.49%
jan 1, 2005
3.103 mln
+64.468K
2.12%
jan 1, 2006
3.167 mln
+63.394K
2.04%
jan 1, 2007
3.276 mln
+109.656K
3.46%
jan 1, 2008
3.464 mln
+188.016K
5.74%
jan 1, 2009
3.393 mln
-71.767K
-2.07%
Ranking of countries by current statistics by years


Comments: