29
/
en
AIzaSyAYiBZKx7MnpbEhh9jyipgxe19OcubqV5w
April 1, 2024
79187
Barbados
BRB
true
2
1
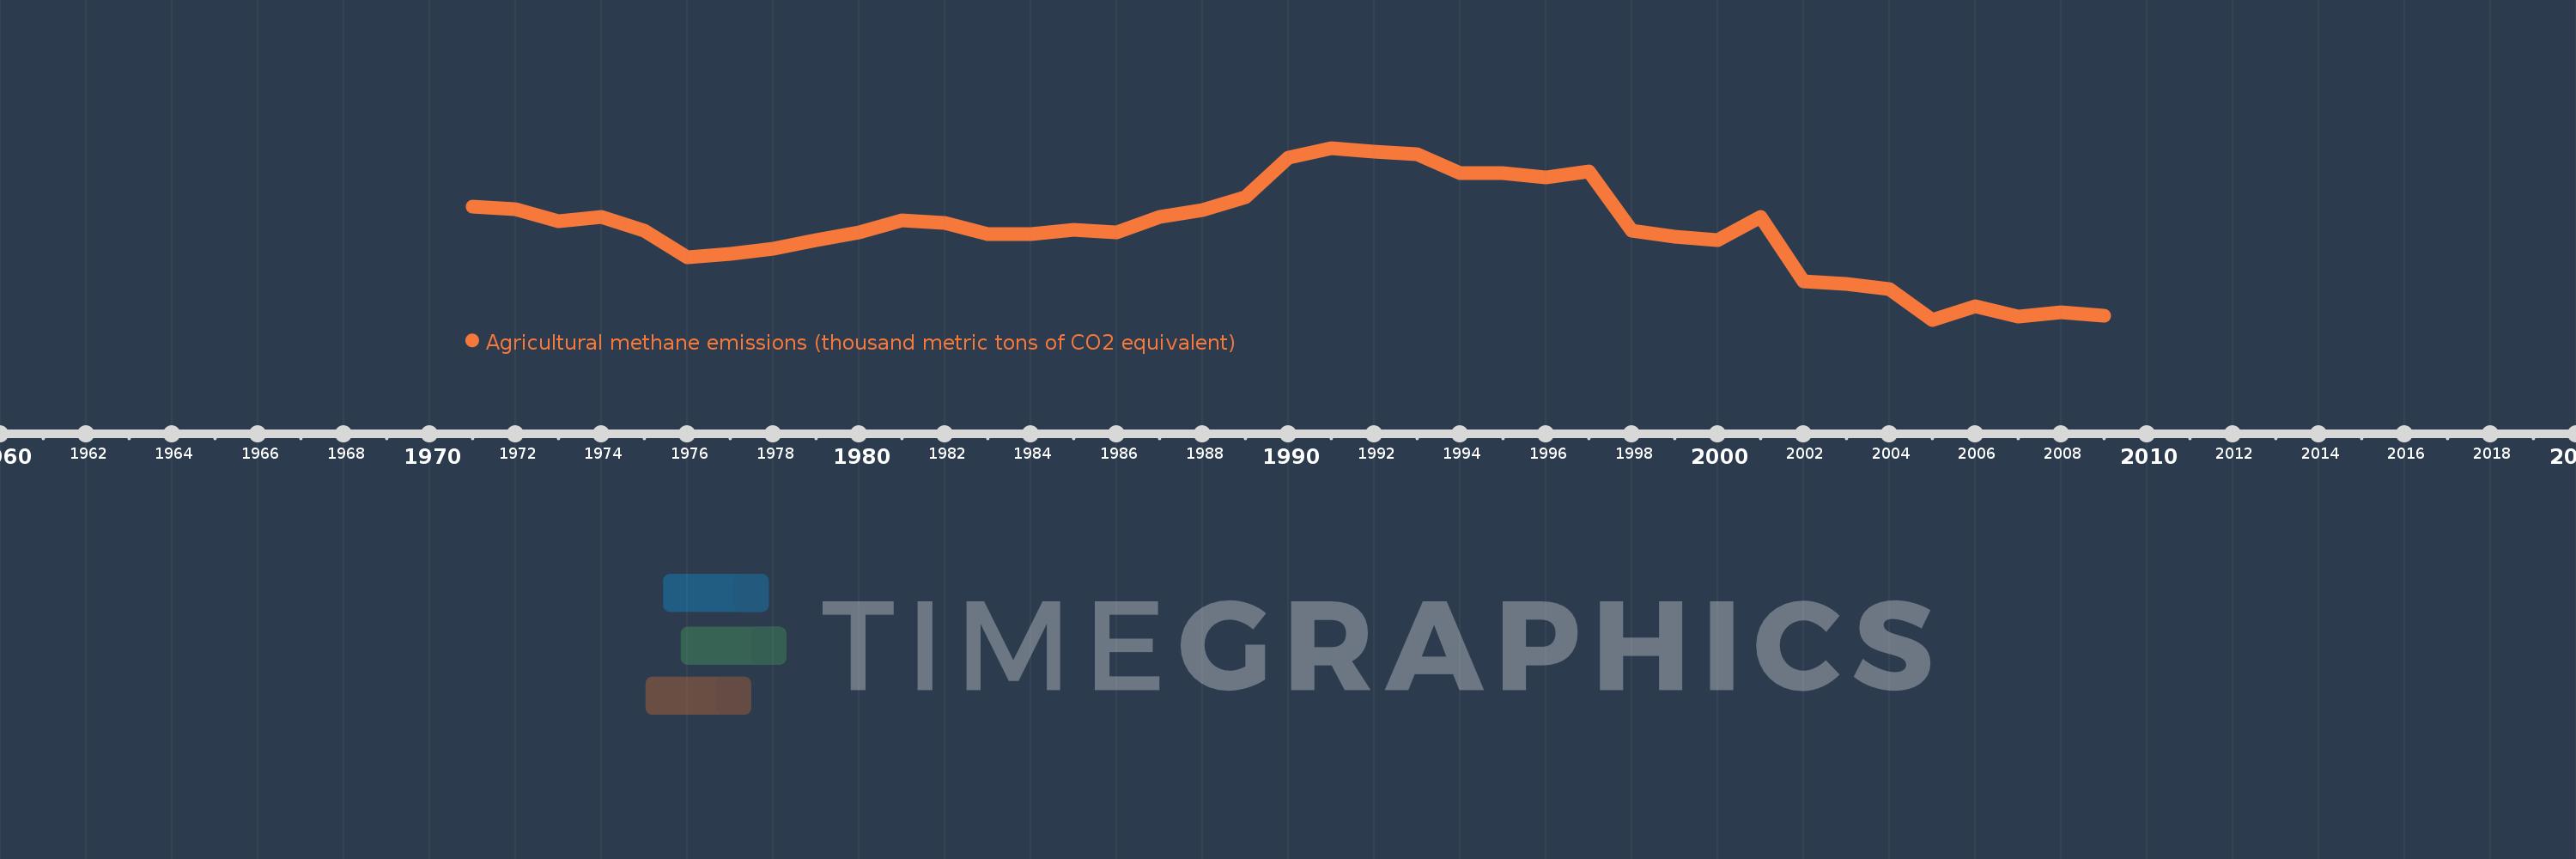
Agricultural methane emissions (thousand metric tons of CO2 equivalent)
2009,2008,2007,2006,2005,2004,2003,2002,2001,2000,1999,1998,1997,1996,1995,1994,1993,1992,1991,1990,1989,1988,1987,1986,1985,1984,1983,1982,1981,1980,1979,1978,1977,1976,1975,1974,1973,1972,1971
This statistics in other country:
AfghanistanAlbaniaAlgeriaAmerican SamoaAndorraAngolaAntigua and BarbudaArab WorldArgentinaArmeniaArubaAustraliaAustriaAzerbaijanBahamas, TheBahrainBangladeshBarbadosBelarusBelgiumBelizeBeninBermudaBhutanBoliviaBosnia and HerzegovinaBotswanaBrazilBritish Virgin IslandsBrunei DarussalamBulgariaBurkina FasoBurundiCabo VerdeCambodiaCameroonCanadaCaribbean small statesCayman IslandsCentral African RepublicCentral Europe and the BalticsChadChannel IslandsChileChinaColombiaComorosCongo, Dem. Rep.Congo, Rep.Costa RicaCote d'IvoireCroatiaCubaCuracaoCyprusCzech RepublicDenmarkDjiboutiDominicaDominican RepublicEarly-demographic dividendEast Asia & PacificEast Asia & Pacific (excluding high income)East Asia & Pacific (IDA & IBRD countries)EcuadorEgypt, Arab Rep.El SalvadorEquatorial GuineaEritreaEstoniaEthiopiaEuro areaEurope & Central AsiaEurope & Central Asia (excluding high income)Europe & Central Asia (IDA & IBRD countries)European UnionFaroe IslandsFijiFinlandFragile and conflict affected situationsFranceFrench PolynesiaGabonGambia, TheGeorgiaGermanyGhanaGibraltarGreeceGreenlandGrenadaGuamGuatemalaGuineaGuinea-BissauGuyanaHaitiHeavily indebted poor countries (HIPC)High incomeHondurasHong Kong SAR, ChinaHungaryIBRD onlyIcelandIDA & IBRD totalIDA blendIDA onlyIDA totalIndiaIndonesiaIran, Islamic Rep.IraqIrelandIsle of ManIsraelItalyJamaicaJapanJordanKazakhstanKenyaKiribatiKorea, Dem. People’s Rep.Korea, Rep.KosovoKuwaitKyrgyz RepublicLao PDRLate-demographic dividendLatin America & Caribbean Latin America & Caribbean (excluding high income)Latin America & the Caribbean (IDA & IBRD countries)LatviaLeast developed countries: UN classificationLebanonLesothoLiberiaLibyaLiechtensteinLithuaniaLow & middle incomeLow incomeLower middle incomeLuxembourgMacao SAR, ChinaMacedonia, FYRMadagascarMalawiMalaysiaMaldivesMaliMaltaMarshall IslandsMauritaniaMauritiusMexicoMicronesia, Fed. Sts.Middle East & North AfricaMiddle East & North Africa (excluding high income)Middle East & North Africa (IDA & IBRD countries)Middle incomeMoldovaMonacoMongoliaMontenegroMoroccoMozambiqueMyanmarNamibiaNauruNepalNetherlandsNew CaledoniaNew ZealandNicaraguaNigerNigeriaNorth AmericaNorthern Mariana IslandsNorwayOECD membersOmanOther small statesPacific island small statesPakistanPalauPanamaPapua New GuineaParaguayPeruPhilippinesPolandPortugalPost-demographic dividendPre-demographic dividendPuerto RicoQatarRomaniaRussian FederationRwandaSamoaSan MarinoSao Tome and PrincipeSaudi ArabiaSenegalSerbiaSeychellesSierra LeoneSingaporeSint Maarten (Dutch part)Slovak RepublicSloveniaSmall statesSolomon IslandsSomaliaSouth AfricaSouth AsiaSouth Asia (IDA & IBRD)South SudanSpainSri LankaSt. Kitts and NevisSt. LuciaSt. Martin (French part)St. Vincent and the GrenadinesSub-Saharan Africa Sub-Saharan Africa (excluding high income)Sub-Saharan Africa (IDA & IBRD countries)SudanSurinameSwazilandSwedenSwitzerlandSyrian Arab RepublicTajikistanTanzaniaThailandTimor-LesteTogoTongaTrinidad and TobagoTunisiaTurkeyTurkmenistanTurks and Caicos IslandsTuvaluUgandaUkraineUnited Arab EmiratesUnited KingdomUnited StatesUpper middle incomeUruguayUzbekistanVanuatuVenezuela, RBVietnamVirgin Islands (U.S.)West Bank and GazaWorldYemen, Rep.ZambiaZimbabwe Timeline:
This timeline shows a graph from 1971 to 2009 of Barbados. No data until 1970. Number of actual observations by date: 39.
Source name:
World Development Indicators
Source organization:
European Commission, Joint Research Centre (JRC)/Netherlands Environmental Assessment Agency (PBL). Emission Database for Global Atmospheric Research (EDGAR): http://edgar.jrc.ec.europa.eu/
Categories, topics:
Agriculture & Rural Development, Environment
Last updated:
apr 23, 2017
Indicators value changes by year
Minimum:
18.253
jan 1, 2005
Maximum:
53.849
jan 1, 1991
At the date of observation
Value
Absolute change
Change from previous value
jan 1, 1971
41.681
+41.681
0.0%
jan 1, 1972
41.165
-0.516
-1.24%
jan 1, 1973
38.753
-2.412
-5.86%
jan 1, 1974
39.575
+0.822
2.12%
jan 1, 1975
36.625
-2.95
-7.45%
jan 1, 1976
31.185
-5.439
-14.85%
jan 1, 1977
31.97
+0.785
2.52%
jan 1, 1978
33.001
+1.031
3.22%
jan 1, 1979
34.761
+1.76
5.33%
jan 1, 1980
36.333
+1.572
4.52%
jan 1, 1981
38.926
+2.593
7.14%
jan 1, 1982
38.4
-0.526
-1.35%
jan 1, 1983
35.999
-2.401
-6.25%
jan 1, 1984
35.917
-0.081
-0.23%
jan 1, 1985
36.865
+0.948
2.64%
jan 1, 1986
36.275
-0.59
-1.6%
jan 1, 1987
39.588
+3.314
9.14%
jan 1, 1988
40.973
+1.385
3.5%
jan 1, 1989
43.686
+2.713
6.62%
jan 1, 1990
51.835
+8.149
18.65%
jan 1, 1991
53.849
+2.013
3.88%
jan 1, 1992
53.167
-0.681
-1.27%
jan 1, 1993
52.566
-0.601
-1.13%
jan 1, 1994
48.691
-3.875
-7.37%
jan 1, 1995
48.656
-0.036
-0.07%
jan 1, 1996
47.706
-0.95
-1.95%
jan 1, 1997
48.999
+1.294
2.71%
jan 1, 1998
36.628
-12.371
-25.25%
jan 1, 1999
35.479
-1.149
-3.14%
jan 1, 2000
34.763
-0.716
-2.02%
jan 1, 2001
39.631
+4.868
14.0%
jan 1, 2002
26.273
-13.358
-33.71%
jan 1, 2003
25.668
-0.605
-2.3%
jan 1, 2004
24.653
-1.015
-3.95%
jan 1, 2005
18.253
-6.4
-25.96%
jan 1, 2006
21.03
+2.776
15.21%
jan 1, 2007
18.963
-2.066
-9.83%
jan 1, 2008
19.796
+0.833
4.39%
jan 1, 2009
19.15
-0.646
-3.26%
Ranking of countries by current statistics by years


Comments: