29
/
en
AIzaSyAYiBZKx7MnpbEhh9jyipgxe19OcubqV5w
April 1, 2024
129059
Estonia
EST
true
2
1
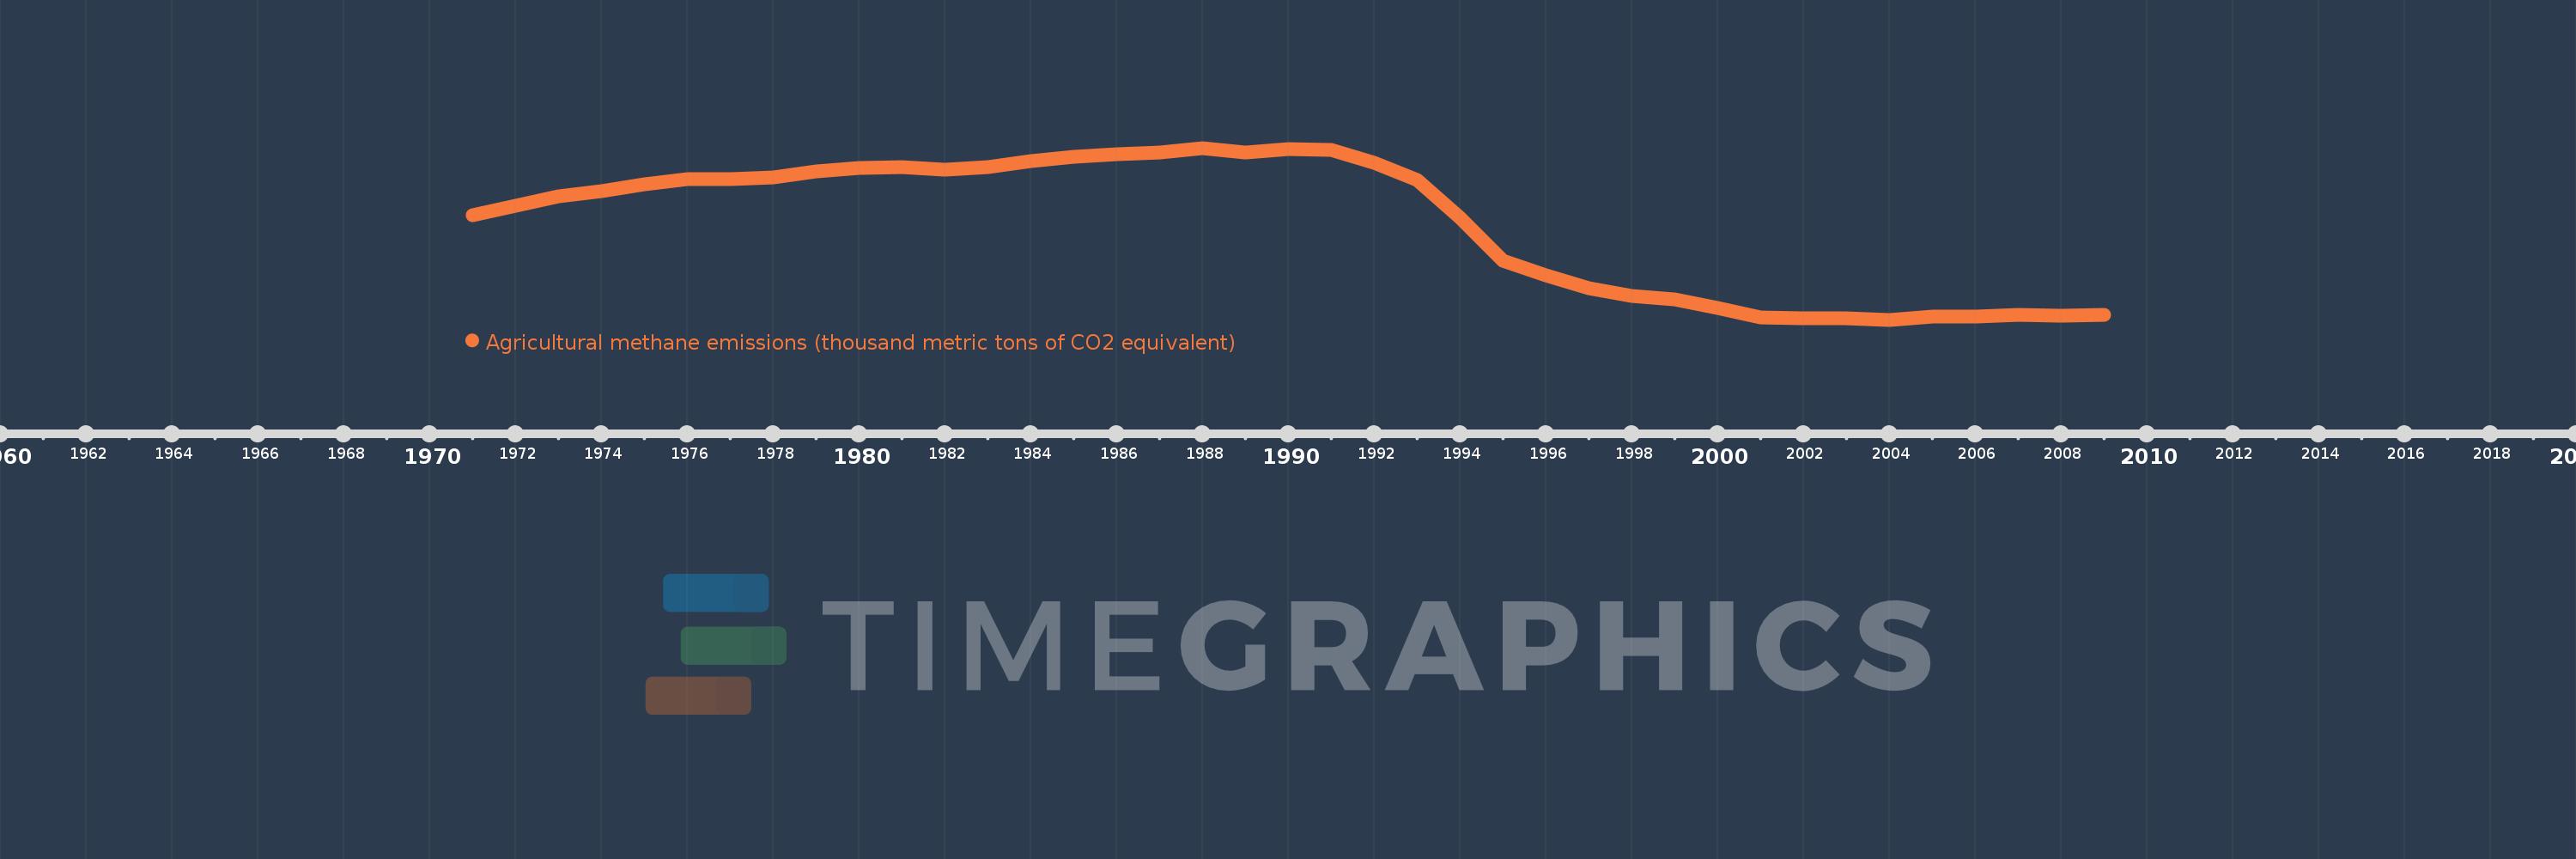
Agricultural methane emissions (thousand metric tons of CO2 equivalent)
2009,2008,2007,2006,2005,2004,2003,2002,2001,2000,1999,1998,1997,1996,1995,1994,1993,1992,1991,1990,1989,1988,1987,1986,1985,1984,1983,1982,1981,1980,1979,1978,1977,1976,1975,1974,1973,1972,1971
This statistics in other country:
AfghanistanAlbaniaAlgeriaAmerican SamoaAndorraAngolaAntigua and BarbudaArab WorldArgentinaArmeniaArubaAustraliaAustriaAzerbaijanBahamas, TheBahrainBangladeshBarbadosBelarusBelgiumBelizeBeninBermudaBhutanBoliviaBosnia and HerzegovinaBotswanaBrazilBritish Virgin IslandsBrunei DarussalamBulgariaBurkina FasoBurundiCabo VerdeCambodiaCameroonCanadaCaribbean small statesCayman IslandsCentral African RepublicCentral Europe and the BalticsChadChannel IslandsChileChinaColombiaComorosCongo, Dem. Rep.Congo, Rep.Costa RicaCote d'IvoireCroatiaCubaCuracaoCyprusCzech RepublicDenmarkDjiboutiDominicaDominican RepublicEarly-demographic dividendEast Asia & PacificEast Asia & Pacific (excluding high income)East Asia & Pacific (IDA & IBRD countries)EcuadorEgypt, Arab Rep.El SalvadorEquatorial GuineaEritreaEstoniaEthiopiaEuro areaEurope & Central AsiaEurope & Central Asia (excluding high income)Europe & Central Asia (IDA & IBRD countries)European UnionFaroe IslandsFijiFinlandFragile and conflict affected situationsFranceFrench PolynesiaGabonGambia, TheGeorgiaGermanyGhanaGibraltarGreeceGreenlandGrenadaGuamGuatemalaGuineaGuinea-BissauGuyanaHaitiHeavily indebted poor countries (HIPC)High incomeHondurasHong Kong SAR, ChinaHungaryIBRD onlyIcelandIDA & IBRD totalIDA blendIDA onlyIDA totalIndiaIndonesiaIran, Islamic Rep.IraqIrelandIsle of ManIsraelItalyJamaicaJapanJordanKazakhstanKenyaKiribatiKorea, Dem. People’s Rep.Korea, Rep.KosovoKuwaitKyrgyz RepublicLao PDRLate-demographic dividendLatin America & Caribbean Latin America & Caribbean (excluding high income)Latin America & the Caribbean (IDA & IBRD countries)LatviaLeast developed countries: UN classificationLebanonLesothoLiberiaLibyaLiechtensteinLithuaniaLow & middle incomeLow incomeLower middle incomeLuxembourgMacao SAR, ChinaMacedonia, FYRMadagascarMalawiMalaysiaMaldivesMaliMaltaMarshall IslandsMauritaniaMauritiusMexicoMicronesia, Fed. Sts.Middle East & North AfricaMiddle East & North Africa (excluding high income)Middle East & North Africa (IDA & IBRD countries)Middle incomeMoldovaMonacoMongoliaMontenegroMoroccoMozambiqueMyanmarNamibiaNauruNepalNetherlandsNew CaledoniaNew ZealandNicaraguaNigerNigeriaNorth AmericaNorthern Mariana IslandsNorwayOECD membersOmanOther small statesPacific island small statesPakistanPalauPanamaPapua New GuineaParaguayPeruPhilippinesPolandPortugalPost-demographic dividendPre-demographic dividendPuerto RicoQatarRomaniaRussian FederationRwandaSamoaSan MarinoSao Tome and PrincipeSaudi ArabiaSenegalSerbiaSeychellesSierra LeoneSingaporeSint Maarten (Dutch part)Slovak RepublicSloveniaSmall statesSolomon IslandsSomaliaSouth AfricaSouth AsiaSouth Asia (IDA & IBRD)South SudanSpainSri LankaSt. Kitts and NevisSt. LuciaSt. Martin (French part)St. Vincent and the GrenadinesSub-Saharan Africa Sub-Saharan Africa (excluding high income)Sub-Saharan Africa (IDA & IBRD countries)SudanSurinameSwazilandSwedenSwitzerlandSyrian Arab RepublicTajikistanTanzaniaThailandTimor-LesteTogoTongaTrinidad and TobagoTunisiaTurkeyTurkmenistanTurks and Caicos IslandsTuvaluUgandaUkraineUnited Arab EmiratesUnited KingdomUnited StatesUpper middle incomeUruguayUzbekistanVanuatuVenezuela, RBVietnamVirgin Islands (U.S.)West Bank and GazaWorldYemen, Rep.ZambiaZimbabwe Timeline:
This timeline shows a graph from 1971 to 2009 of Estonia. No data until 1970. Number of actual observations by date: 39.
Source name:
World Development Indicators
Source organization:
European Commission, Joint Research Centre (JRC)/Netherlands Environmental Assessment Agency (PBL). Emission Database for Global Atmospheric Research (EDGAR): http://edgar.jrc.ec.europa.eu/
Categories, topics:
Agriculture & Rural Development, Environment
Last updated:
apr 23, 2017
Indicators value changes by year
Minimum:
625.054
jan 1, 2004
Maximum:
1.697K
jan 1, 1988
At the date of observation
Value
Absolute change
Change from previous value
jan 1, 1971
1.277K
+1.277K
0.0%
jan 1, 1972
1.338K
+61.661
4.83%
jan 1, 1973
1.395K
+56.462
4.22%
jan 1, 1974
1.427K
+32.315
2.32%
jan 1, 1975
1.469K
+42.222
2.96%
jan 1, 1976
1.502K
+32.864
2.24%
jan 1, 1977
1.504K
+1.679
0.11%
jan 1, 1978
1.515K
+11.552
0.77%
jan 1, 1979
1.552K
+36.693
2.42%
jan 1, 1980
1.57K
+17.792
1.15%
jan 1, 1981
1.579K
+9.413
0.6%
jan 1, 1982
1.561K
-18.715
-1.19%
jan 1, 1983
1.578K
+17.495
1.12%
jan 1, 1984
1.617K
+38.692
2.45%
jan 1, 1985
1.641K
+23.897
1.48%
jan 1, 1986
1.657K
+16.427
1.0%
jan 1, 1987
1.667K
+9.989
0.6%
jan 1, 1988
1.697K
+29.562
1.77%
jan 1, 1989
1.67K
-26.647
-1.57%
jan 1, 1990
1.692K
+22.133
1.33%
jan 1, 1991
1.685K
-6.865
-0.41%
jan 1, 1992
1.602K
-83.541
-4.96%
jan 1, 1993
1.496K
-105.923
-6.61%
jan 1, 1994
1.263K
-232.93
-15.57%
jan 1, 1995
994.754
-268.089
-21.23%
jan 1, 1996
902.981
-91.773
-9.23%
jan 1, 1997
819.021
-83.96
-9.3%
jan 1, 1998
771.148
-47.873
-5.85%
jan 1, 1999
750.977
-20.171
-2.62%
jan 1, 2000
698.676
-52.301
-6.96%
jan 1, 2001
637.962
-60.714
-8.69%
jan 1, 2002
633.68
-4.282
-0.67%
jan 1, 2003
633.368
-0.313
-0.05%
jan 1, 2004
625.054
-8.314
-1.31%
jan 1, 2005
643.581
+18.527
2.96%
jan 1, 2006
642.996
-0.585
-0.09%
jan 1, 2007
652.979
+9.983
1.55%
jan 1, 2008
650.422
-2.558
-0.39%
jan 1, 2009
654.117
+3.696
0.57%
Ranking of countries by current statistics by years


Comments: