29
/
en
AIzaSyAYiBZKx7MnpbEhh9jyipgxe19OcubqV5w
April 1, 2024
95770
Burundi
BDI
true
2
1
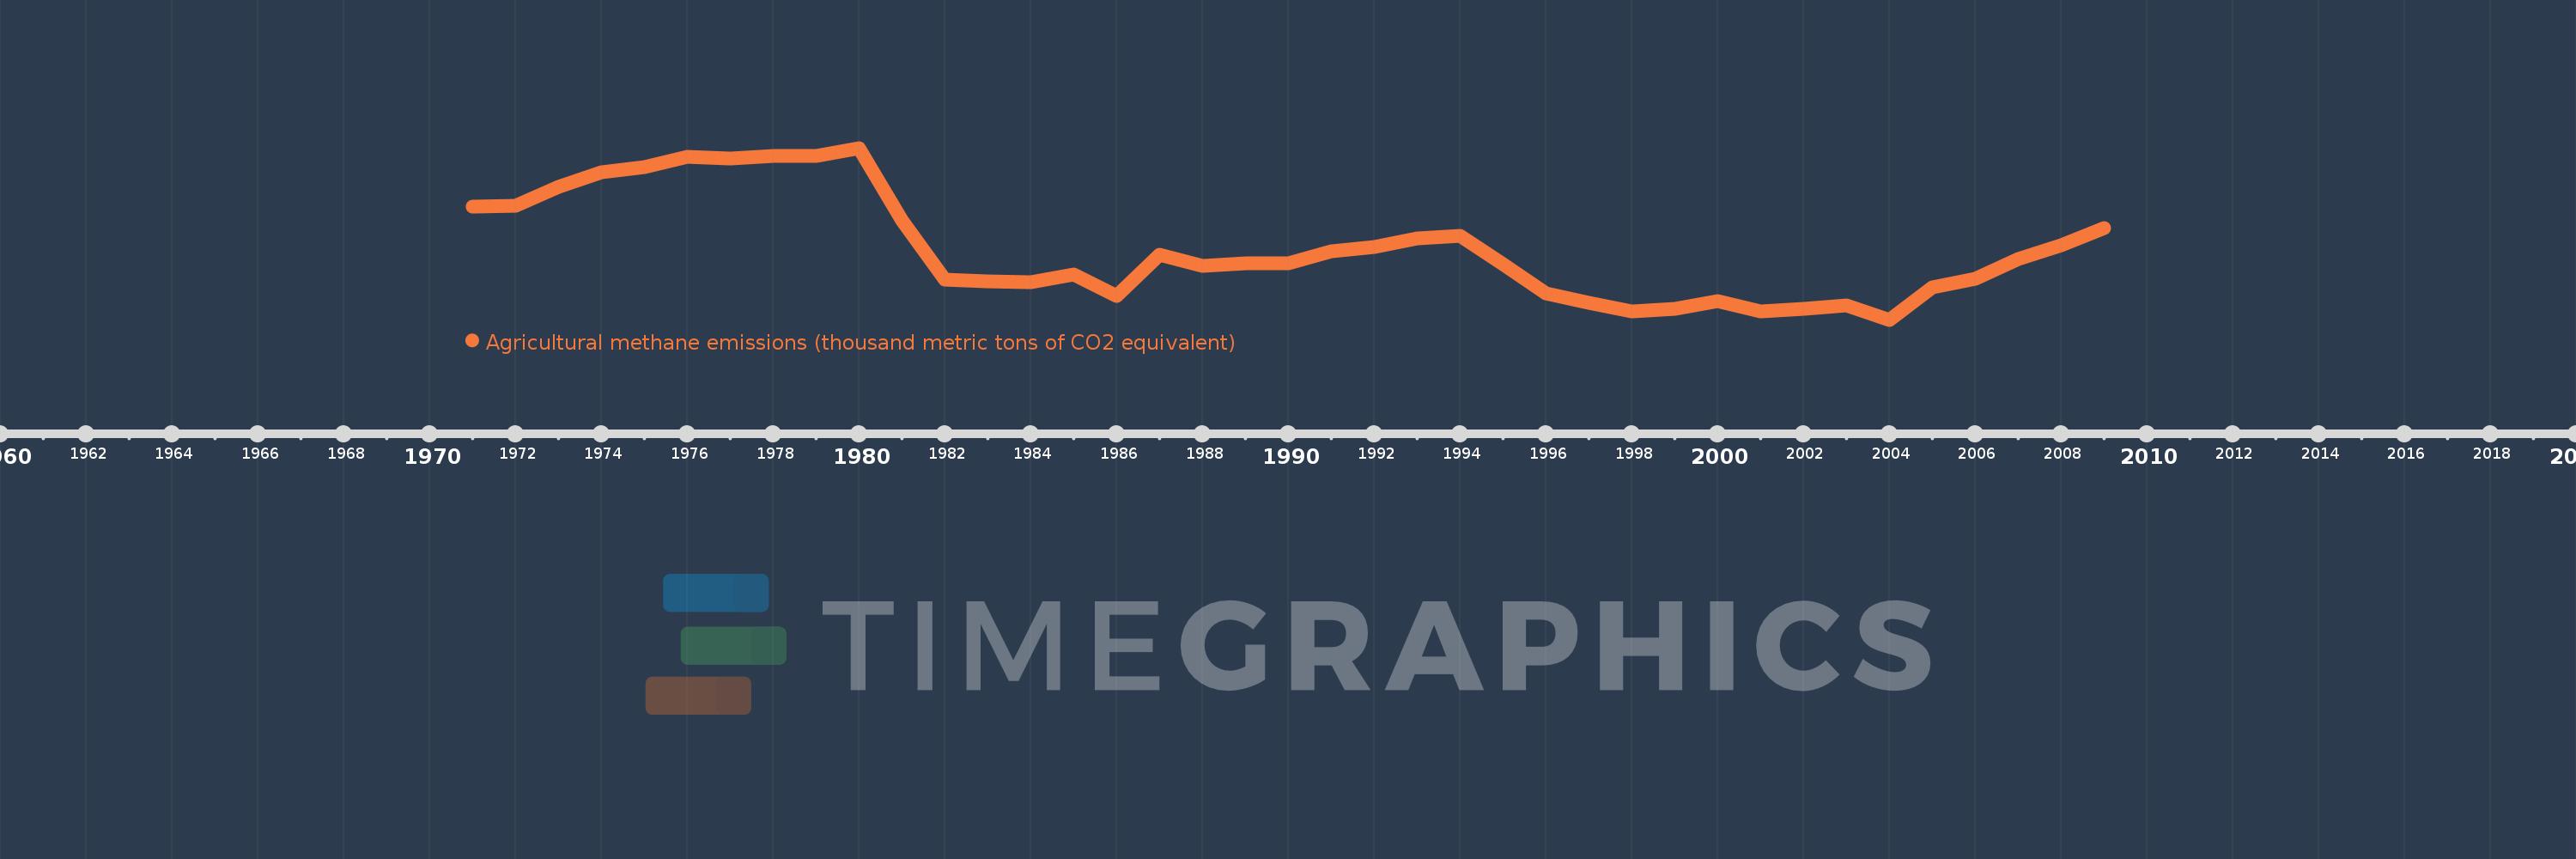
Agricultural methane emissions (thousand metric tons of CO2 equivalent)
2009,2008,2007,2006,2005,2004,2003,2002,2001,2000,1999,1998,1997,1996,1995,1994,1993,1992,1991,1990,1989,1988,1987,1986,1985,1984,1983,1982,1981,1980,1979,1978,1977,1976,1975,1974,1973,1972,1971
This statistics in other country:
AfghanistanAlbaniaAlgeriaAmerican SamoaAndorraAngolaAntigua and BarbudaArab WorldArgentinaArmeniaArubaAustraliaAustriaAzerbaijanBahamas, TheBahrainBangladeshBarbadosBelarusBelgiumBelizeBeninBermudaBhutanBoliviaBosnia and HerzegovinaBotswanaBrazilBritish Virgin IslandsBrunei DarussalamBulgariaBurkina FasoBurundiCabo VerdeCambodiaCameroonCanadaCaribbean small statesCayman IslandsCentral African RepublicCentral Europe and the BalticsChadChannel IslandsChileChinaColombiaComorosCongo, Dem. Rep.Congo, Rep.Costa RicaCote d'IvoireCroatiaCubaCuracaoCyprusCzech RepublicDenmarkDjiboutiDominicaDominican RepublicEarly-demographic dividendEast Asia & PacificEast Asia & Pacific (excluding high income)East Asia & Pacific (IDA & IBRD countries)EcuadorEgypt, Arab Rep.El SalvadorEquatorial GuineaEritreaEstoniaEthiopiaEuro areaEurope & Central AsiaEurope & Central Asia (excluding high income)Europe & Central Asia (IDA & IBRD countries)European UnionFaroe IslandsFijiFinlandFragile and conflict affected situationsFranceFrench PolynesiaGabonGambia, TheGeorgiaGermanyGhanaGibraltarGreeceGreenlandGrenadaGuamGuatemalaGuineaGuinea-BissauGuyanaHaitiHeavily indebted poor countries (HIPC)High incomeHondurasHong Kong SAR, ChinaHungaryIBRD onlyIcelandIDA & IBRD totalIDA blendIDA onlyIDA totalIndiaIndonesiaIran, Islamic Rep.IraqIrelandIsle of ManIsraelItalyJamaicaJapanJordanKazakhstanKenyaKiribatiKorea, Dem. People’s Rep.Korea, Rep.KosovoKuwaitKyrgyz RepublicLao PDRLate-demographic dividendLatin America & Caribbean Latin America & Caribbean (excluding high income)Latin America & the Caribbean (IDA & IBRD countries)LatviaLeast developed countries: UN classificationLebanonLesothoLiberiaLibyaLiechtensteinLithuaniaLow & middle incomeLow incomeLower middle incomeLuxembourgMacao SAR, ChinaMacedonia, FYRMadagascarMalawiMalaysiaMaldivesMaliMaltaMarshall IslandsMauritaniaMauritiusMexicoMicronesia, Fed. Sts.Middle East & North AfricaMiddle East & North Africa (excluding high income)Middle East & North Africa (IDA & IBRD countries)Middle incomeMoldovaMonacoMongoliaMontenegroMoroccoMozambiqueMyanmarNamibiaNauruNepalNetherlandsNew CaledoniaNew ZealandNicaraguaNigerNigeriaNorth AmericaNorthern Mariana IslandsNorwayOECD membersOmanOther small statesPacific island small statesPakistanPalauPanamaPapua New GuineaParaguayPeruPhilippinesPolandPortugalPost-demographic dividendPre-demographic dividendPuerto RicoQatarRomaniaRussian FederationRwandaSamoaSan MarinoSao Tome and PrincipeSaudi ArabiaSenegalSerbiaSeychellesSierra LeoneSingaporeSint Maarten (Dutch part)Slovak RepublicSloveniaSmall statesSolomon IslandsSomaliaSouth AfricaSouth AsiaSouth Asia (IDA & IBRD)South SudanSpainSri LankaSt. Kitts and NevisSt. LuciaSt. Martin (French part)St. Vincent and the GrenadinesSub-Saharan Africa Sub-Saharan Africa (excluding high income)Sub-Saharan Africa (IDA & IBRD countries)SudanSurinameSwazilandSwedenSwitzerlandSyrian Arab RepublicTajikistanTanzaniaThailandTimor-LesteTogoTongaTrinidad and TobagoTunisiaTurkeyTurkmenistanTurks and Caicos IslandsTuvaluUgandaUkraineUnited Arab EmiratesUnited KingdomUnited StatesUpper middle incomeUruguayUzbekistanVanuatuVenezuela, RBVietnamVirgin Islands (U.S.)West Bank and GazaWorldYemen, Rep.ZambiaZimbabwe Timeline:
This timeline shows a graph from 1971 to 2009 of Burundi. No data until 1970. Number of actual observations by date: 39.
Source name:
World Development Indicators
Source organization:
European Commission, Joint Research Centre (JRC)/Netherlands Environmental Assessment Agency (PBL). Emission Database for Global Atmospheric Research (EDGAR): http://edgar.jrc.ec.europa.eu/
Categories, topics:
Agriculture & Rural Development, Environment
Last updated:
apr 23, 2017
Indicators value changes by year
Minimum:
375.545
jan 1, 2004
Maximum:
722.324
jan 1, 1980
At the date of observation
Value
Absolute change
Change from previous value
jan 1, 1971
604.36
+604.36
0.0%
jan 1, 1972
604.854
+0.494
0.08%
jan 1, 1973
643.477
+38.623
6.39%
jan 1, 1974
674.019
+30.542
4.75%
jan 1, 1975
683.743
+9.724
1.44%
jan 1, 1976
705.136
+21.393
3.13%
jan 1, 1977
701.036
-4.1
-0.58%
jan 1, 1978
705.383
+4.347
0.62%
jan 1, 1979
706.041
+0.658
0.09%
jan 1, 1980
722.324
+16.283
2.31%
jan 1, 1981
576.904
-145.42
-20.13%
jan 1, 1982
455.756
-121.148
-21.0%
jan 1, 1983
452.841
-2.916
-0.64%
jan 1, 1984
452.017
-0.823
-0.18%
jan 1, 1985
467.703
+15.686
3.47%
jan 1, 1986
423.705
-43.999
-9.41%
jan 1, 1987
506.792
+83.087
19.61%
jan 1, 1988
484.562
-22.23
-4.39%
jan 1, 1989
490.165
+5.603
1.16%
jan 1, 1990
490.308
+0.144
0.03%
jan 1, 1991
514.127
+23.818
4.86%
jan 1, 1992
522.443
+8.317
1.62%
jan 1, 1993
540.109
+17.666
3.38%
jan 1, 1994
545.531
+5.422
1.0%
jan 1, 1995
487.015
-58.517
-10.73%
jan 1, 1996
428.021
-58.994
-12.11%
jan 1, 1997
409.312
-18.708
-4.37%
jan 1, 1998
392.33
-16.982
-4.15%
jan 1, 1999
397.676
+5.346
1.36%
jan 1, 2000
413.892
+16.216
4.08%
jan 1, 2001
391.518
-22.375
-5.41%
jan 1, 2002
396.892
+5.374
1.37%
jan 1, 2003
404.577
+7.686
1.94%
jan 1, 2004
375.545
-29.032
-7.18%
jan 1, 2005
441.307
+65.761
17.51%
jan 1, 2006
458.304
+16.998
3.85%
jan 1, 2007
498.414
+40.109
8.75%
jan 1, 2008
526.626
+28.212
5.66%
jan 1, 2009
560.979
+34.353
6.52%
Ranking of countries by current statistics by years


Comments: