29
/
en
AIzaSyAYiBZKx7MnpbEhh9jyipgxe19OcubqV5w
April 1, 2024
97014
Cabo Verde
CPV
true
2
1
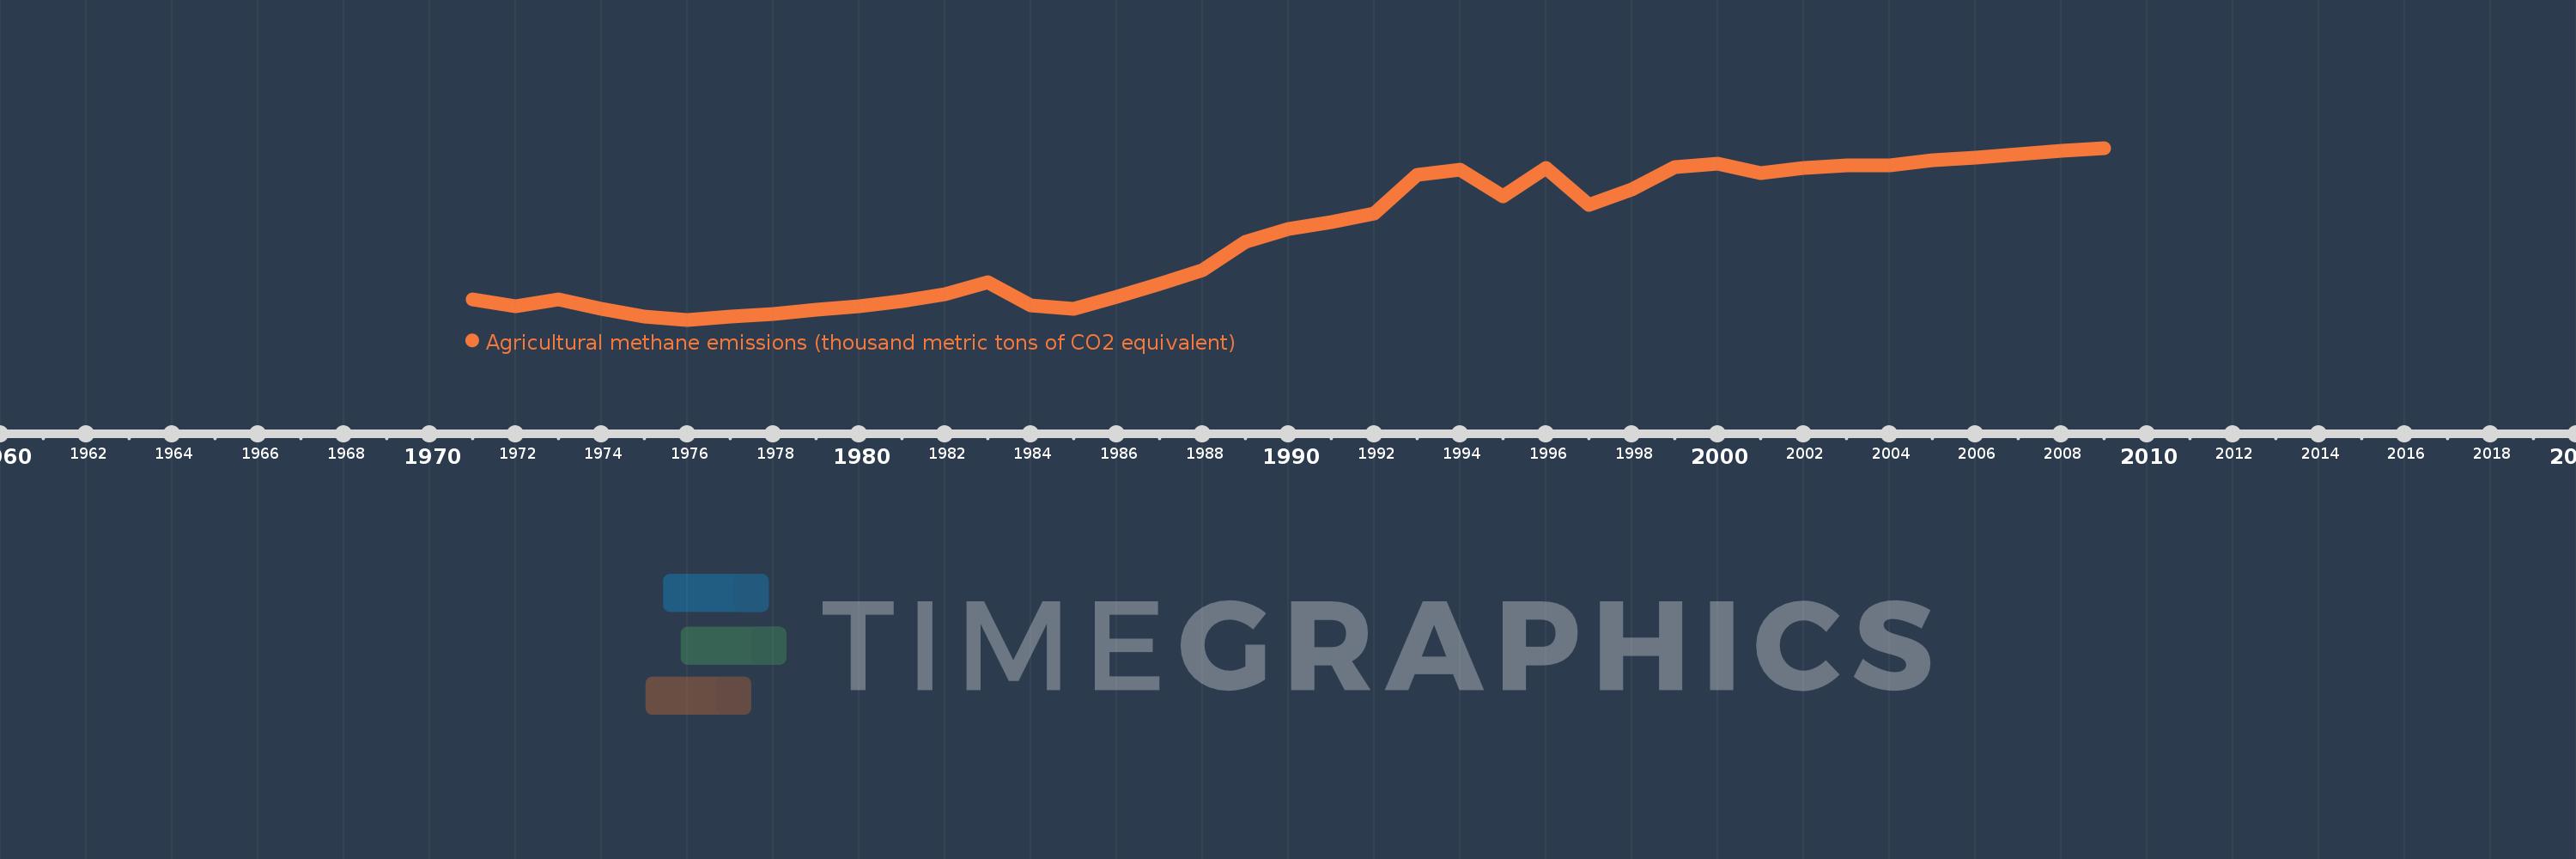
Agricultural methane emissions (thousand metric tons of CO2 equivalent)
2009,2008,2007,2006,2005,2004,2003,2002,2001,2000,1999,1998,1997,1996,1995,1994,1993,1992,1991,1990,1989,1988,1987,1986,1985,1984,1983,1982,1981,1980,1979,1978,1977,1976,1975,1974,1973,1972,1971
This statistics in other country:
AfghanistanAlbaniaAlgeriaAmerican SamoaAndorraAngolaAntigua and BarbudaArab WorldArgentinaArmeniaArubaAustraliaAustriaAzerbaijanBahamas, TheBahrainBangladeshBarbadosBelarusBelgiumBelizeBeninBermudaBhutanBoliviaBosnia and HerzegovinaBotswanaBrazilBritish Virgin IslandsBrunei DarussalamBulgariaBurkina FasoBurundiCabo VerdeCambodiaCameroonCanadaCaribbean small statesCayman IslandsCentral African RepublicCentral Europe and the BalticsChadChannel IslandsChileChinaColombiaComorosCongo, Dem. Rep.Congo, Rep.Costa RicaCote d'IvoireCroatiaCubaCuracaoCyprusCzech RepublicDenmarkDjiboutiDominicaDominican RepublicEarly-demographic dividendEast Asia & PacificEast Asia & Pacific (excluding high income)East Asia & Pacific (IDA & IBRD countries)EcuadorEgypt, Arab Rep.El SalvadorEquatorial GuineaEritreaEstoniaEthiopiaEuro areaEurope & Central AsiaEurope & Central Asia (excluding high income)Europe & Central Asia (IDA & IBRD countries)European UnionFaroe IslandsFijiFinlandFragile and conflict affected situationsFranceFrench PolynesiaGabonGambia, TheGeorgiaGermanyGhanaGibraltarGreeceGreenlandGrenadaGuamGuatemalaGuineaGuinea-BissauGuyanaHaitiHeavily indebted poor countries (HIPC)High incomeHondurasHong Kong SAR, ChinaHungaryIBRD onlyIcelandIDA & IBRD totalIDA blendIDA onlyIDA totalIndiaIndonesiaIran, Islamic Rep.IraqIrelandIsle of ManIsraelItalyJamaicaJapanJordanKazakhstanKenyaKiribatiKorea, Dem. People’s Rep.Korea, Rep.KosovoKuwaitKyrgyz RepublicLao PDRLate-demographic dividendLatin America & Caribbean Latin America & Caribbean (excluding high income)Latin America & the Caribbean (IDA & IBRD countries)LatviaLeast developed countries: UN classificationLebanonLesothoLiberiaLibyaLiechtensteinLithuaniaLow & middle incomeLow incomeLower middle incomeLuxembourgMacao SAR, ChinaMacedonia, FYRMadagascarMalawiMalaysiaMaldivesMaliMaltaMarshall IslandsMauritaniaMauritiusMexicoMicronesia, Fed. Sts.Middle East & North AfricaMiddle East & North Africa (excluding high income)Middle East & North Africa (IDA & IBRD countries)Middle incomeMoldovaMonacoMongoliaMontenegroMoroccoMozambiqueMyanmarNamibiaNauruNepalNetherlandsNew CaledoniaNew ZealandNicaraguaNigerNigeriaNorth AmericaNorthern Mariana IslandsNorwayOECD membersOmanOther small statesPacific island small statesPakistanPalauPanamaPapua New GuineaParaguayPeruPhilippinesPolandPortugalPost-demographic dividendPre-demographic dividendPuerto RicoQatarRomaniaRussian FederationRwandaSamoaSan MarinoSao Tome and PrincipeSaudi ArabiaSenegalSerbiaSeychellesSierra LeoneSingaporeSint Maarten (Dutch part)Slovak RepublicSloveniaSmall statesSolomon IslandsSomaliaSouth AfricaSouth AsiaSouth Asia (IDA & IBRD)South SudanSpainSri LankaSt. Kitts and NevisSt. LuciaSt. Martin (French part)St. Vincent and the GrenadinesSub-Saharan Africa Sub-Saharan Africa (excluding high income)Sub-Saharan Africa (IDA & IBRD countries)SudanSurinameSwazilandSwedenSwitzerlandSyrian Arab RepublicTajikistanTanzaniaThailandTimor-LesteTogoTongaTrinidad and TobagoTunisiaTurkeyTurkmenistanTurks and Caicos IslandsTuvaluUgandaUkraineUnited Arab EmiratesUnited KingdomUnited StatesUpper middle incomeUruguayUzbekistanVanuatuVenezuela, RBVietnamVirgin Islands (U.S.)West Bank and GazaWorldYemen, Rep.ZambiaZimbabwe Timeline:
This timeline shows a graph from 1971 to 2009 of Cabo Verde. No data until 1970. Number of actual observations by date: 39.
Source name:
World Development Indicators
Source organization:
European Commission, Joint Research Centre (JRC)/Netherlands Environmental Assessment Agency (PBL). Emission Database for Global Atmospheric Research (EDGAR): http://edgar.jrc.ec.europa.eu/
Categories, topics:
Agriculture & Rural Development, Environment
Last updated:
apr 23, 2017
Indicators value changes by year
Minimum:
16.781
jan 1, 1976
Maximum:
54.614
jan 1, 2009
At the date of observation
Value
Absolute change
Change from previous value
jan 1, 1971
21.205
+21.205
0.0%
jan 1, 1972
19.728
-1.477
-6.96%
jan 1, 1973
21.24
+1.512
7.66%
jan 1, 1974
19.217
-2.023
-9.52%
jan 1, 1975
17.572
-1.645
-8.56%
jan 1, 1976
16.781
-0.791
-4.5%
jan 1, 1977
17.471
+0.69
4.11%
jan 1, 1978
18.046
+0.575
3.29%
jan 1, 1979
18.967
+0.921
5.11%
jan 1, 1980
19.702
+0.735
3.87%
jan 1, 1981
20.895
+1.194
6.06%
jan 1, 1982
22.385
+1.49
7.13%
jan 1, 1983
25.059
+2.674
11.95%
jan 1, 1984
19.87
-5.19
-20.71%
jan 1, 1985
19.22
-0.649
-3.27%
jan 1, 1986
21.816
+2.595
13.5%
jan 1, 1987
24.701
+2.885
13.23%
jan 1, 1988
27.647
+2.946
11.93%
jan 1, 1989
33.848
+6.201
22.43%
jan 1, 1990
36.733
+2.885
8.52%
jan 1, 1991
38.213
+1.481
4.03%
jan 1, 1992
40.177
+1.964
5.14%
jan 1, 1993
48.778
+8.601
21.41%
jan 1, 1994
49.843
+1.065
2.18%
jan 1, 1995
43.953
-5.89
-11.82%
jan 1, 1996
50.206
+6.253
14.23%
jan 1, 1997
42.008
-8.198
-16.33%
jan 1, 1998
45.473
+3.466
8.25%
jan 1, 1999
50.425
+4.952
10.89%
jan 1, 2000
51.068
+0.643
1.27%
jan 1, 2001
49.079
-1.989
-3.89%
jan 1, 2002
50.257
+1.178
2.4%
jan 1, 2003
50.775
+0.518
1.03%
jan 1, 2004
50.767
-0.008
-0.02%
jan 1, 2005
51.966
+1.199
2.36%
jan 1, 2006
52.398
+0.433
0.83%
jan 1, 2007
53.29
+0.892
1.7%
jan 1, 2008
53.905
+0.615
1.15%
jan 1, 2009
54.614
+0.709
1.32%
Ranking of countries by current statistics by years


Comments: