29
/
en
AIzaSyAYiBZKx7MnpbEhh9jyipgxe19OcubqV5w
April 1, 2024
219289
Papua New Guinea
PNG
true
2
1
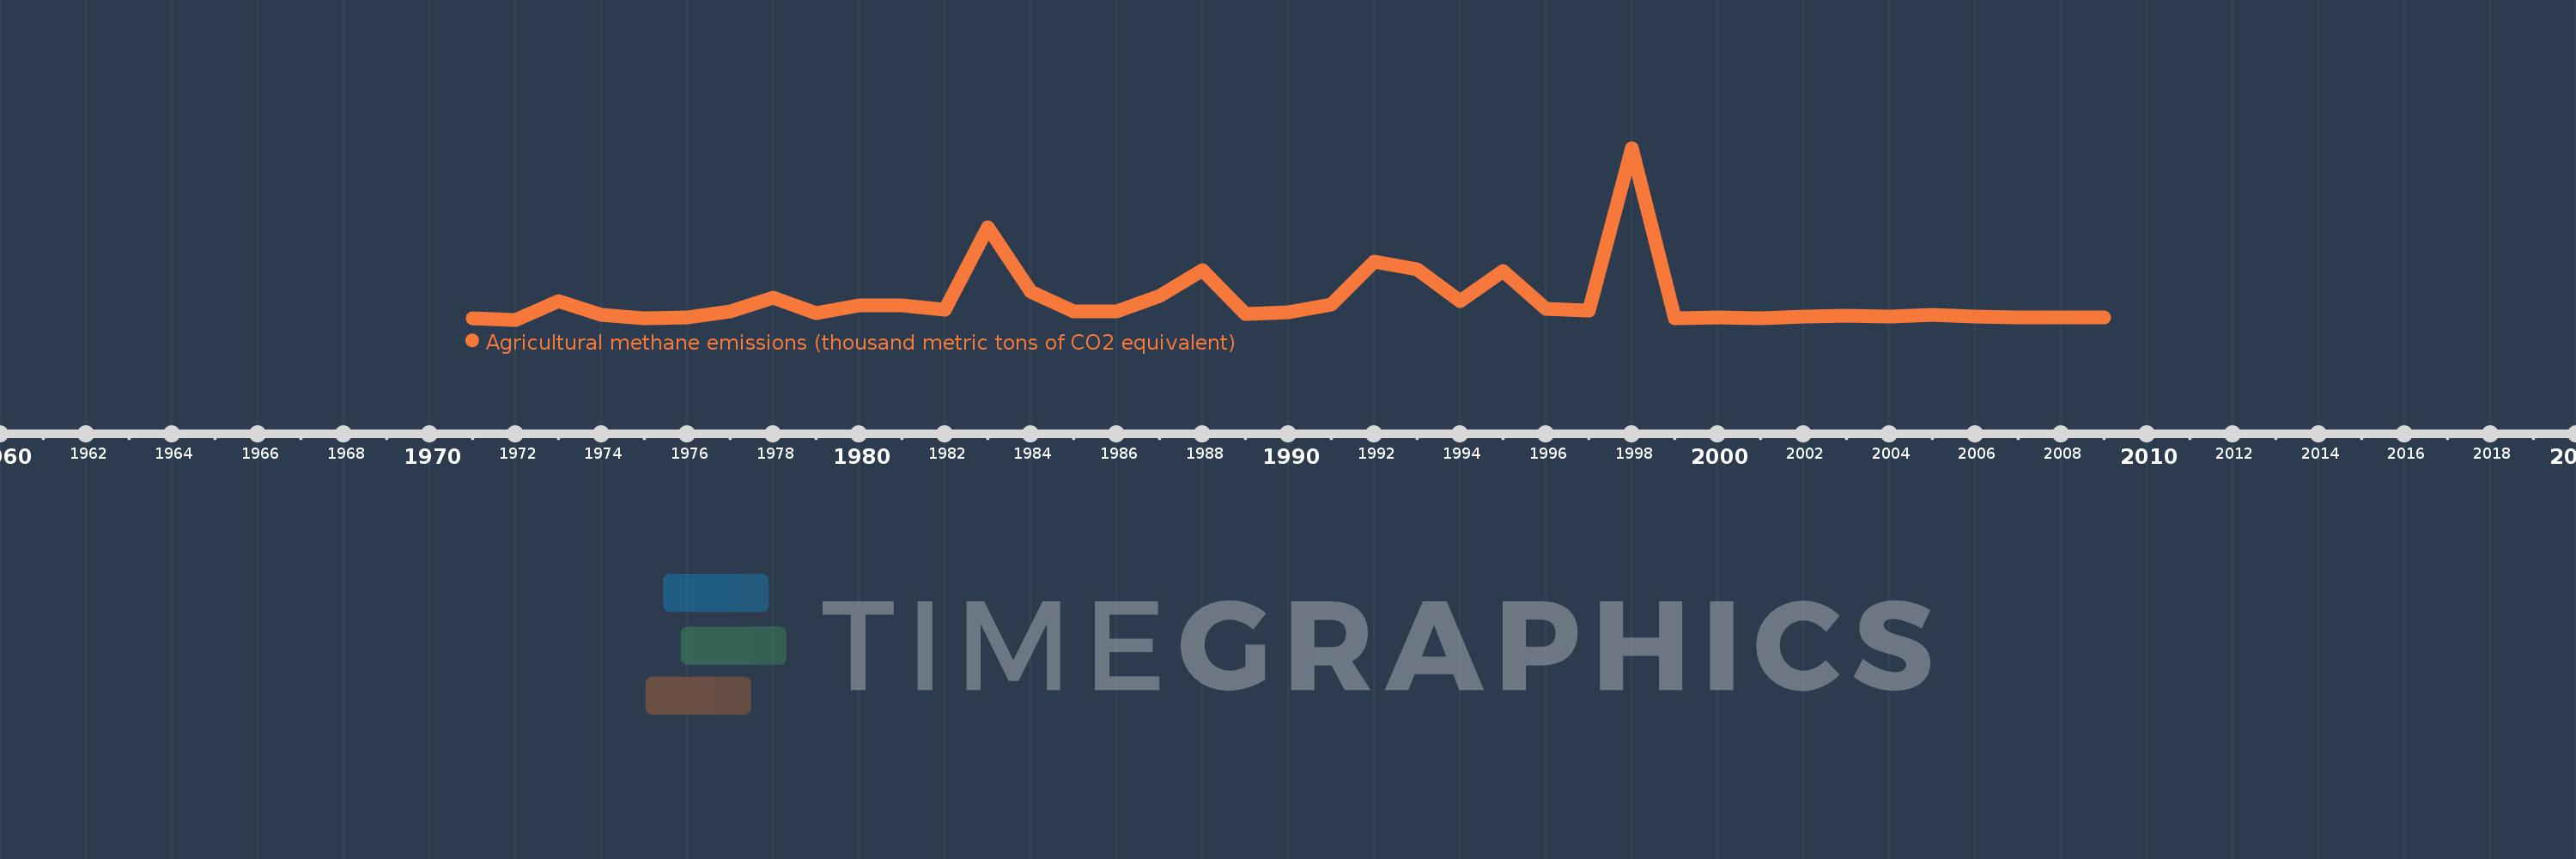
Agricultural methane emissions (thousand metric tons of CO2 equivalent)
2009,2008,2007,2006,2005,2004,2003,2002,2001,2000,1999,1998,1997,1996,1995,1994,1993,1992,1991,1990,1989,1988,1987,1986,1985,1984,1983,1982,1981,1980,1979,1978,1977,1976,1975,1974,1973,1972,1971
This statistics in other country:
AfghanistanAlbaniaAlgeriaAmerican SamoaAndorraAngolaAntigua and BarbudaArab WorldArgentinaArmeniaArubaAustraliaAustriaAzerbaijanBahamas, TheBahrainBangladeshBarbadosBelarusBelgiumBelizeBeninBermudaBhutanBoliviaBosnia and HerzegovinaBotswanaBrazilBritish Virgin IslandsBrunei DarussalamBulgariaBurkina FasoBurundiCabo VerdeCambodiaCameroonCanadaCaribbean small statesCayman IslandsCentral African RepublicCentral Europe and the BalticsChadChannel IslandsChileChinaColombiaComorosCongo, Dem. Rep.Congo, Rep.Costa RicaCote d'IvoireCroatiaCubaCuracaoCyprusCzech RepublicDenmarkDjiboutiDominicaDominican RepublicEarly-demographic dividendEast Asia & PacificEast Asia & Pacific (excluding high income)East Asia & Pacific (IDA & IBRD countries)EcuadorEgypt, Arab Rep.El SalvadorEquatorial GuineaEritreaEstoniaEthiopiaEuro areaEurope & Central AsiaEurope & Central Asia (excluding high income)Europe & Central Asia (IDA & IBRD countries)European UnionFaroe IslandsFijiFinlandFragile and conflict affected situationsFranceFrench PolynesiaGabonGambia, TheGeorgiaGermanyGhanaGibraltarGreeceGreenlandGrenadaGuamGuatemalaGuineaGuinea-BissauGuyanaHaitiHeavily indebted poor countries (HIPC)High incomeHondurasHong Kong SAR, ChinaHungaryIBRD onlyIcelandIDA & IBRD totalIDA blendIDA onlyIDA totalIndiaIndonesiaIran, Islamic Rep.IraqIrelandIsle of ManIsraelItalyJamaicaJapanJordanKazakhstanKenyaKiribatiKorea, Dem. People’s Rep.Korea, Rep.KosovoKuwaitKyrgyz RepublicLao PDRLate-demographic dividendLatin America & Caribbean Latin America & Caribbean (excluding high income)Latin America & the Caribbean (IDA & IBRD countries)LatviaLeast developed countries: UN classificationLebanonLesothoLiberiaLibyaLiechtensteinLithuaniaLow & middle incomeLow incomeLower middle incomeLuxembourgMacao SAR, ChinaMacedonia, FYRMadagascarMalawiMalaysiaMaldivesMaliMaltaMarshall IslandsMauritaniaMauritiusMexicoMicronesia, Fed. Sts.Middle East & North AfricaMiddle East & North Africa (excluding high income)Middle East & North Africa (IDA & IBRD countries)Middle incomeMoldovaMonacoMongoliaMontenegroMoroccoMozambiqueMyanmarNamibiaNauruNepalNetherlandsNew CaledoniaNew ZealandNicaraguaNigerNigeriaNorth AmericaNorthern Mariana IslandsNorwayOECD membersOmanOther small statesPacific island small statesPakistanPalauPanamaPapua New GuineaParaguayPeruPhilippinesPolandPortugalPost-demographic dividendPre-demographic dividendPuerto RicoQatarRomaniaRussian FederationRwandaSamoaSan MarinoSao Tome and PrincipeSaudi ArabiaSenegalSerbiaSeychellesSierra LeoneSingaporeSint Maarten (Dutch part)Slovak RepublicSloveniaSmall statesSolomon IslandsSomaliaSouth AfricaSouth AsiaSouth Asia (IDA & IBRD)South SudanSpainSri LankaSt. Kitts and NevisSt. LuciaSt. Martin (French part)St. Vincent and the GrenadinesSub-Saharan Africa Sub-Saharan Africa (excluding high income)Sub-Saharan Africa (IDA & IBRD countries)SudanSurinameSwazilandSwedenSwitzerlandSyrian Arab RepublicTajikistanTanzaniaThailandTimor-LesteTogoTongaTrinidad and TobagoTunisiaTurkeyTurkmenistanTurks and Caicos IslandsTuvaluUgandaUkraineUnited Arab EmiratesUnited KingdomUnited StatesUpper middle incomeUruguayUzbekistanVanuatuVenezuela, RBVietnamVirgin Islands (U.S.)West Bank and GazaWorldYemen, Rep.ZambiaZimbabwe Timeline:
This timeline shows a graph from 1971 to 2009 of Papua New Guinea. No data until 1970. Number of actual observations by date: 39.
Source name:
World Development Indicators
Source organization:
European Commission, Joint Research Centre (JRC)/Netherlands Environmental Assessment Agency (PBL). Emission Database for Global Atmospheric Research (EDGAR): http://edgar.jrc.ec.europa.eu/
Categories, topics:
Agriculture & Rural Development, Environment
Last updated:
apr 23, 2017
Indicators value changes by year
Minimum:
234.274
jan 1, 1972
Maximum:
4.474K
jan 1, 1998
At the date of observation
Value
Absolute change
Change from previous value
jan 1, 1971
271.642
+271.642
0.0%
jan 1, 1972
234.274
-37.368
-13.76%
jan 1, 1973
692.609
+458.335
195.64%
jan 1, 1974
358.665
-333.944
-48.22%
jan 1, 1975
275.999
-82.666
-23.05%
jan 1, 1976
284.303
+8.304
3.01%
jan 1, 1977
442.689
+158.386
55.71%
jan 1, 1978
788.638
+345.949
78.15%
jan 1, 1979
392.314
-396.324
-50.25%
jan 1, 1980
593.524
+201.209
51.29%
jan 1, 1981
589.977
-3.547
-0.6%
jan 1, 1982
490.83
-99.147
-16.81%
jan 1, 1983
2.519K
+2.028K
413.19%
jan 1, 1984
933.43
-1.585K
-62.94%
jan 1, 1985
436.663
-496.766
-53.22%
jan 1, 1986
435.716
-0.947
-0.22%
jan 1, 1987
832.0
+396.284
90.95%
jan 1, 1988
1.465K
+633.262
76.11%
jan 1, 1989
371.691
-1.094K
-74.63%
jan 1, 1990
421.874
+50.183
13.5%
jan 1, 1991
619.857
+197.984
46.93%
jan 1, 1992
1.659K
+1.039K
167.68%
jan 1, 1993
1.469K
-190.12
-11.46%
jan 1, 1994
684.53
-784.594
-53.41%
jan 1, 1995
1.437K
+752.399
109.91%
jan 1, 1996
502.382
-934.547
-65.04%
jan 1, 1997
455.836
-46.546
-9.27%
jan 1, 1998
4.474K
+4.018K
881.53%
jan 1, 1999
273.358
-4.201K
-93.89%
jan 1, 2000
282.591
+9.233
3.38%
jan 1, 2001
270.765
-11.826
-4.18%
jan 1, 2002
305.648
+34.883
12.88%
jan 1, 2003
325.782
+20.134
6.59%
jan 1, 2004
316.369
-9.413
-2.89%
jan 1, 2005
355.439
+39.07
12.35%
jan 1, 2006
308.347
-47.092
-13.25%
jan 1, 2007
299.406
-8.941
-2.9%
jan 1, 2008
300.365
+0.959
0.32%
jan 1, 2009
299.97
-0.395
-0.13%
Ranking of countries by current statistics by years


Comments: