29
/
en
AIzaSyAYiBZKx7MnpbEhh9jyipgxe19OcubqV5w
April 1, 2024
57855
South Asia (IDA & IBRD)
TSA
false
2
1
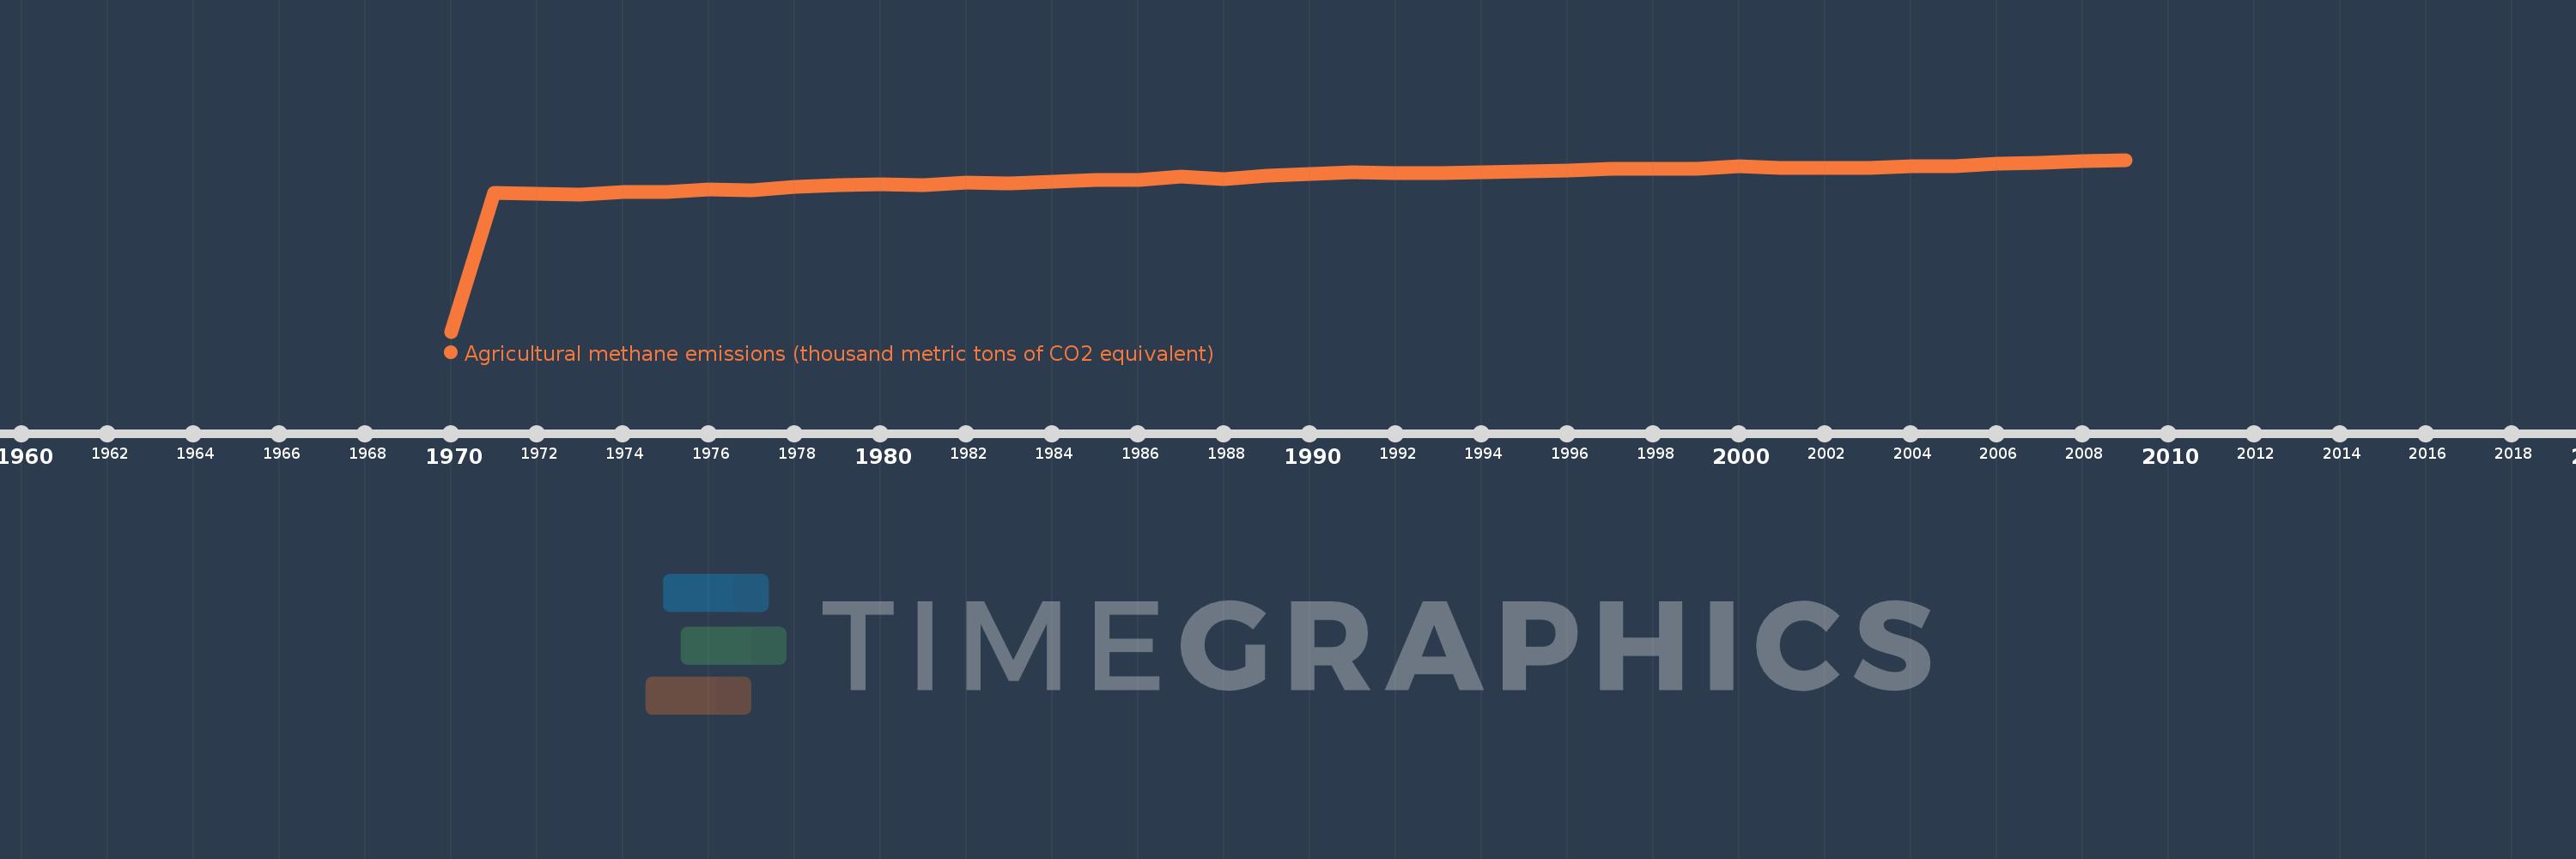
Agricultural methane emissions (thousand metric tons of CO2 equivalent)
2009,2008,2007,2006,2005,2004,2003,2002,2001,2000,1999,1998,1997,1996,1995,1994,1993,1992,1991,1990,1989,1988,1987,1986,1985,1984,1983,1982,1981,1980,1979,1978,1977,1976,1975,1974,1973,1972,1971,1970
This statistics in other country:
AfghanistanAlbaniaAlgeriaAmerican SamoaAndorraAngolaAntigua and BarbudaArab WorldArgentinaArmeniaArubaAustraliaAustriaAzerbaijanBahamas, TheBahrainBangladeshBarbadosBelarusBelgiumBelizeBeninBermudaBhutanBoliviaBosnia and HerzegovinaBotswanaBrazilBritish Virgin IslandsBrunei DarussalamBulgariaBurkina FasoBurundiCabo VerdeCambodiaCameroonCanadaCaribbean small statesCayman IslandsCentral African RepublicCentral Europe and the BalticsChadChannel IslandsChileChinaColombiaComorosCongo, Dem. Rep.Congo, Rep.Costa RicaCote d'IvoireCroatiaCubaCuracaoCyprusCzech RepublicDenmarkDjiboutiDominicaDominican RepublicEarly-demographic dividendEast Asia & PacificEast Asia & Pacific (excluding high income)East Asia & Pacific (IDA & IBRD countries)EcuadorEgypt, Arab Rep.El SalvadorEquatorial GuineaEritreaEstoniaEthiopiaEuro areaEurope & Central AsiaEurope & Central Asia (excluding high income)Europe & Central Asia (IDA & IBRD countries)European UnionFaroe IslandsFijiFinlandFragile and conflict affected situationsFranceFrench PolynesiaGabonGambia, TheGeorgiaGermanyGhanaGibraltarGreeceGreenlandGrenadaGuamGuatemalaGuineaGuinea-BissauGuyanaHaitiHeavily indebted poor countries (HIPC)High incomeHondurasHong Kong SAR, ChinaHungaryIBRD onlyIcelandIDA & IBRD totalIDA blendIDA onlyIDA totalIndiaIndonesiaIran, Islamic Rep.IraqIrelandIsle of ManIsraelItalyJamaicaJapanJordanKazakhstanKenyaKiribatiKorea, Dem. People’s Rep.Korea, Rep.KosovoKuwaitKyrgyz RepublicLao PDRLate-demographic dividendLatin America & Caribbean Latin America & Caribbean (excluding high income)Latin America & the Caribbean (IDA & IBRD countries)LatviaLeast developed countries: UN classificationLebanonLesothoLiberiaLibyaLiechtensteinLithuaniaLow & middle incomeLow incomeLower middle incomeLuxembourgMacao SAR, ChinaMacedonia, FYRMadagascarMalawiMalaysiaMaldivesMaliMaltaMarshall IslandsMauritaniaMauritiusMexicoMicronesia, Fed. Sts.Middle East & North AfricaMiddle East & North Africa (excluding high income)Middle East & North Africa (IDA & IBRD countries)Middle incomeMoldovaMonacoMongoliaMontenegroMoroccoMozambiqueMyanmarNamibiaNauruNepalNetherlandsNew CaledoniaNew ZealandNicaraguaNigerNigeriaNorth AmericaNorthern Mariana IslandsNorwayOECD membersOmanOther small statesPacific island small statesPakistanPalauPanamaPapua New GuineaParaguayPeruPhilippinesPolandPortugalPost-demographic dividendPre-demographic dividendPuerto RicoQatarRomaniaRussian FederationRwandaSamoaSan MarinoSao Tome and PrincipeSaudi ArabiaSenegalSerbiaSeychellesSierra LeoneSingaporeSint Maarten (Dutch part)Slovak RepublicSloveniaSmall statesSolomon IslandsSomaliaSouth AfricaSouth AsiaSouth Asia (IDA & IBRD)South SudanSpainSri LankaSt. Kitts and NevisSt. LuciaSt. Martin (French part)St. Vincent and the GrenadinesSub-Saharan Africa Sub-Saharan Africa (excluding high income)Sub-Saharan Africa (IDA & IBRD countries)SudanSurinameSwazilandSwedenSwitzerlandSyrian Arab RepublicTajikistanTanzaniaThailandTimor-LesteTogoTongaTrinidad and TobagoTunisiaTurkeyTurkmenistanTurks and Caicos IslandsTuvaluUgandaUkraineUnited Arab EmiratesUnited KingdomUnited StatesUpper middle incomeUruguayUzbekistanVanuatuVenezuela, RBVietnamVirgin Islands (U.S.)West Bank and GazaWorldYemen, Rep.ZambiaZimbabwe Timeline:
This timeline shows a graph from 1970 to 2009 of South Asia (IDA & IBRD). No data until 1969. Number of actual observations by date: 40.
Source name:
World Development Indicators
Source organization:
European Commission, Joint Research Centre (JRC)/Netherlands Environmental Assessment Agency (PBL). Emission Database for Global Atmospheric Research (EDGAR): http://edgar.jrc.ec.europa.eu/
Categories, topics:
Agriculture & Rural Development, Environment
Last updated:
apr 23, 2017
Indicators value changes by year
Maximum:
575.416K
jan 1, 2009
At the date of observation
Value
Absolute change
Change from previous value
jan 1, 1971
465.785K
+465.785K
%
jan 1, 1972
462.081K
-3.704K
-0.8%
jan 1, 1973
459.595K
-2.486K
-0.54%
jan 1, 1974
466.487K
+6.892K
1.5%
jan 1, 1975
468.547K
+2.06K
0.44%
jan 1, 1976
477.162K
+8.615K
1.84%
jan 1, 1977
474.673K
-2.489K
-0.52%
jan 1, 1978
484.468K
+9.795K
2.06%
jan 1, 1979
491.679K
+7.211K
1.49%
jan 1, 1980
492.599K
+919.554
0.19%
jan 1, 1981
491.553K
-1.046K
-0.21%
jan 1, 1982
498.394K
+6.841K
1.39%
jan 1, 1983
496.389K
-2.005K
-0.4%
jan 1, 1984
502.471K
+6.082K
1.23%
jan 1, 1985
508.107K
+5.637K
1.12%
jan 1, 1986
509.024K
+916.774
0.18%
jan 1, 1987
517.974K
+8.95K
1.76%
jan 1, 1988
510.405K
-7.569K
-1.46%
jan 1, 1989
522.136K
+11.731K
2.3%
jan 1, 1990
527.504K
+5.368K
1.03%
jan 1, 1991
532.292K
+4.788K
0.91%
jan 1, 1992
532.013K
-278.274
-0.05%
jan 1, 1993
531.662K
-350.804
-0.07%
jan 1, 1994
534.929K
+3.266K
0.61%
jan 1, 1995
537.132K
+2.203K
0.41%
jan 1, 1996
539.94K
+2.808K
0.52%
jan 1, 1997
544.734K
+4.794K
0.89%
jan 1, 1998
545.303K
+569.59
0.1%
jan 1, 1999
546.407K
+1.103K
0.2%
jan 1, 2000
554.051K
+7.645K
1.4%
jan 1, 2001
549.464K
-4.587K
-0.83%
jan 1, 2002
549.196K
-268.719
-0.05%
jan 1, 2003
547.034K
-2.162K
-0.39%
jan 1, 2004
555.073K
+8.04K
1.47%
jan 1, 2005
554.058K
-1.015K
-0.18%
jan 1, 2006
562.044K
+7.986K
1.44%
jan 1, 2007
565.107K
+3.063K
0.54%
jan 1, 2008
570.964K
+5.857K
1.04%
jan 1, 2009
575.416K
+4.453K
0.78%
Ranking of countries by current statistics by years


Comments: