29
/
en
AIzaSyAYiBZKx7MnpbEhh9jyipgxe19OcubqV5w
April 1, 2024
116616
Cyprus
CYP
true
2
1
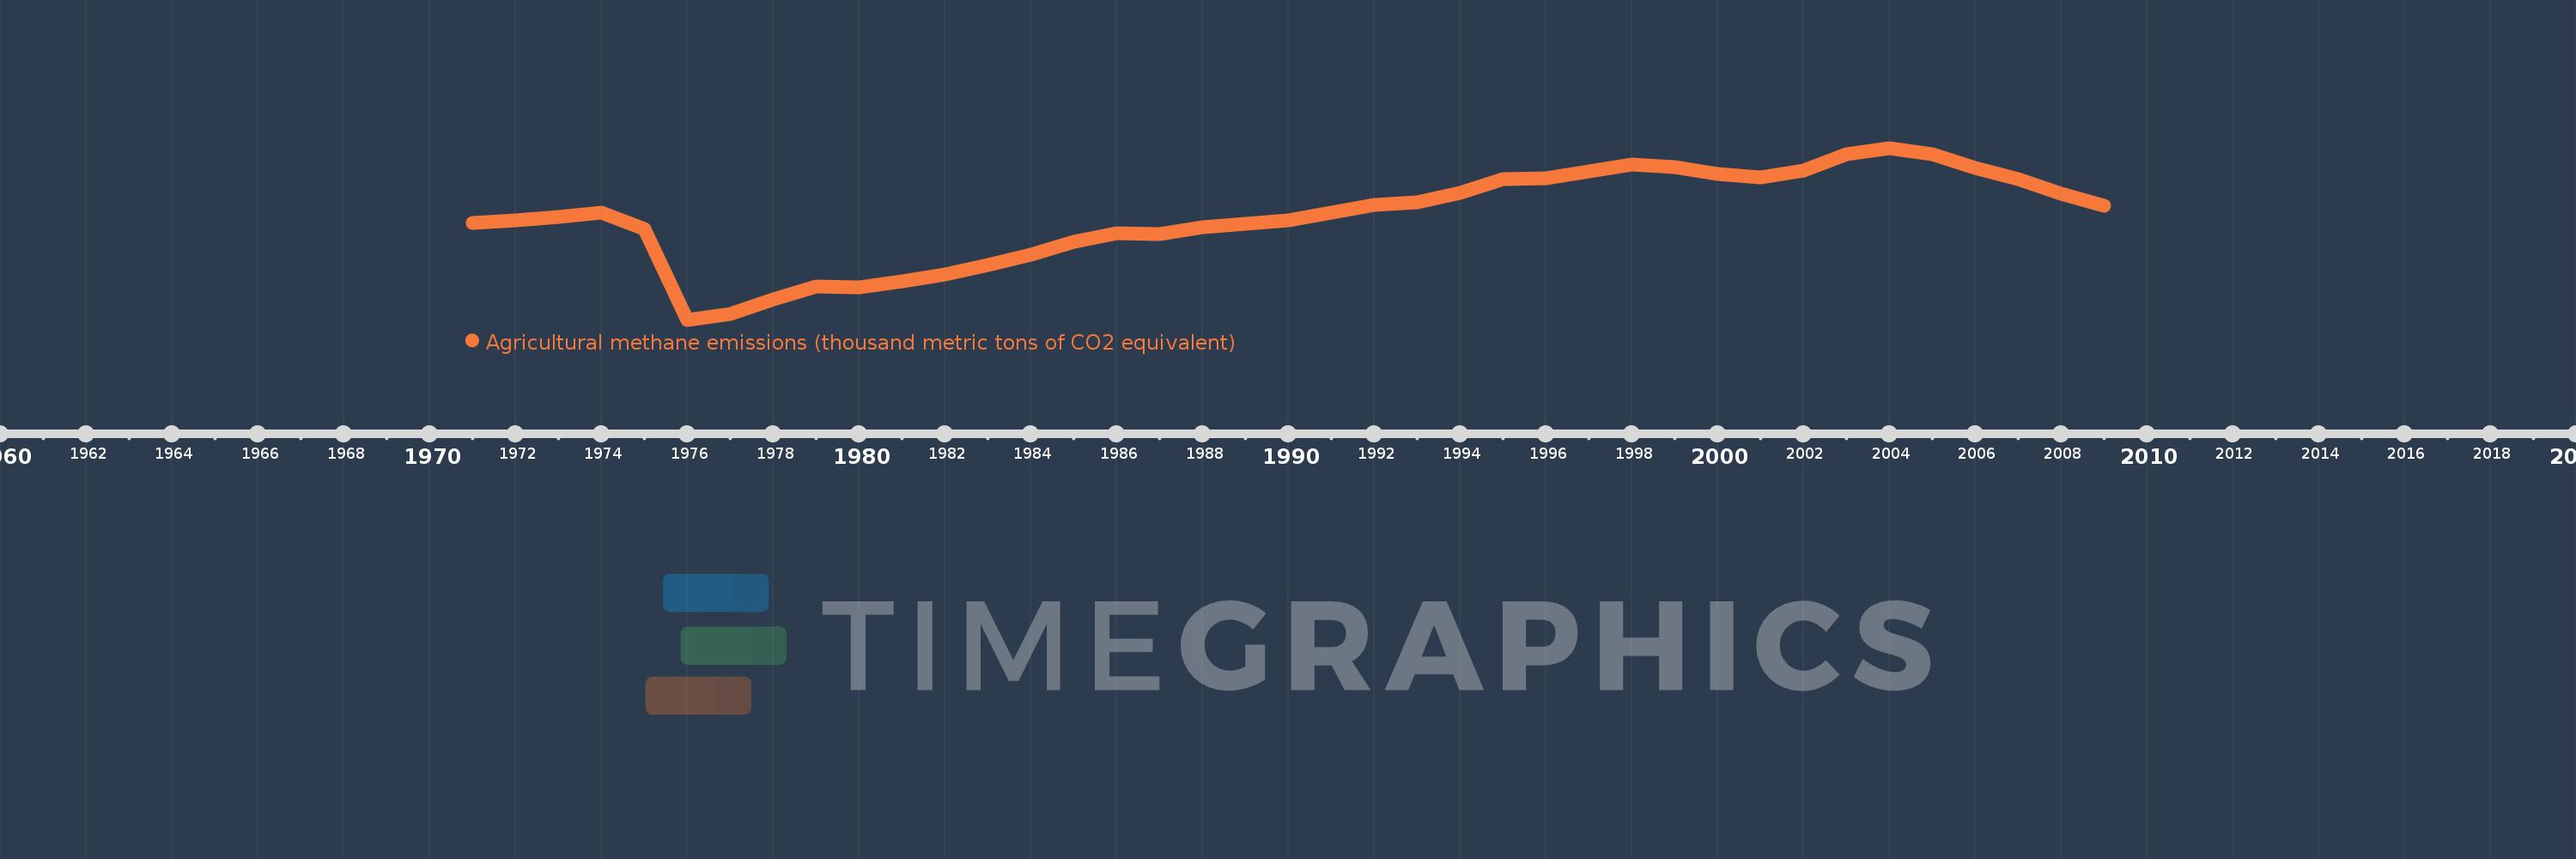
Agricultural methane emissions (thousand metric tons of CO2 equivalent)
2009,2008,2007,2006,2005,2004,2003,2002,2001,2000,1999,1998,1997,1996,1995,1994,1993,1992,1991,1990,1989,1988,1987,1986,1985,1984,1983,1982,1981,1980,1979,1978,1977,1976,1975,1974,1973,1972,1971
This statistics in other country:
AfghanistanAlbaniaAlgeriaAmerican SamoaAndorraAngolaAntigua and BarbudaArab WorldArgentinaArmeniaArubaAustraliaAustriaAzerbaijanBahamas, TheBahrainBangladeshBarbadosBelarusBelgiumBelizeBeninBermudaBhutanBoliviaBosnia and HerzegovinaBotswanaBrazilBritish Virgin IslandsBrunei DarussalamBulgariaBurkina FasoBurundiCabo VerdeCambodiaCameroonCanadaCaribbean small statesCayman IslandsCentral African RepublicCentral Europe and the BalticsChadChannel IslandsChileChinaColombiaComorosCongo, Dem. Rep.Congo, Rep.Costa RicaCote d'IvoireCroatiaCubaCuracaoCyprusCzech RepublicDenmarkDjiboutiDominicaDominican RepublicEarly-demographic dividendEast Asia & PacificEast Asia & Pacific (excluding high income)East Asia & Pacific (IDA & IBRD countries)EcuadorEgypt, Arab Rep.El SalvadorEquatorial GuineaEritreaEstoniaEthiopiaEuro areaEurope & Central AsiaEurope & Central Asia (excluding high income)Europe & Central Asia (IDA & IBRD countries)European UnionFaroe IslandsFijiFinlandFragile and conflict affected situationsFranceFrench PolynesiaGabonGambia, TheGeorgiaGermanyGhanaGibraltarGreeceGreenlandGrenadaGuamGuatemalaGuineaGuinea-BissauGuyanaHaitiHeavily indebted poor countries (HIPC)High incomeHondurasHong Kong SAR, ChinaHungaryIBRD onlyIcelandIDA & IBRD totalIDA blendIDA onlyIDA totalIndiaIndonesiaIran, Islamic Rep.IraqIrelandIsle of ManIsraelItalyJamaicaJapanJordanKazakhstanKenyaKiribatiKorea, Dem. People’s Rep.Korea, Rep.KosovoKuwaitKyrgyz RepublicLao PDRLate-demographic dividendLatin America & Caribbean Latin America & Caribbean (excluding high income)Latin America & the Caribbean (IDA & IBRD countries)LatviaLeast developed countries: UN classificationLebanonLesothoLiberiaLibyaLiechtensteinLithuaniaLow & middle incomeLow incomeLower middle incomeLuxembourgMacao SAR, ChinaMacedonia, FYRMadagascarMalawiMalaysiaMaldivesMaliMaltaMarshall IslandsMauritaniaMauritiusMexicoMicronesia, Fed. Sts.Middle East & North AfricaMiddle East & North Africa (excluding high income)Middle East & North Africa (IDA & IBRD countries)Middle incomeMoldovaMonacoMongoliaMontenegroMoroccoMozambiqueMyanmarNamibiaNauruNepalNetherlandsNew CaledoniaNew ZealandNicaraguaNigerNigeriaNorth AmericaNorthern Mariana IslandsNorwayOECD membersOmanOther small statesPacific island small statesPakistanPalauPanamaPapua New GuineaParaguayPeruPhilippinesPolandPortugalPost-demographic dividendPre-demographic dividendPuerto RicoQatarRomaniaRussian FederationRwandaSamoaSan MarinoSao Tome and PrincipeSaudi ArabiaSenegalSerbiaSeychellesSierra LeoneSingaporeSint Maarten (Dutch part)Slovak RepublicSloveniaSmall statesSolomon IslandsSomaliaSouth AfricaSouth AsiaSouth Asia (IDA & IBRD)South SudanSpainSri LankaSt. Kitts and NevisSt. LuciaSt. Martin (French part)St. Vincent and the GrenadinesSub-Saharan Africa Sub-Saharan Africa (excluding high income)Sub-Saharan Africa (IDA & IBRD countries)SudanSurinameSwazilandSwedenSwitzerlandSyrian Arab RepublicTajikistanTanzaniaThailandTimor-LesteTogoTongaTrinidad and TobagoTunisiaTurkeyTurkmenistanTurks and Caicos IslandsTuvaluUgandaUkraineUnited Arab EmiratesUnited KingdomUnited StatesUpper middle incomeUruguayUzbekistanVanuatuVenezuela, RBVietnamVirgin Islands (U.S.)West Bank and GazaWorldYemen, Rep.ZambiaZimbabwe Timeline:
This timeline shows a graph from 1971 to 2009 of Cyprus. No data until 1970. Number of actual observations by date: 39.
Source name:
World Development Indicators
Source organization:
European Commission, Joint Research Centre (JRC)/Netherlands Environmental Assessment Agency (PBL). Emission Database for Global Atmospheric Research (EDGAR): http://edgar.jrc.ec.europa.eu/
Categories, topics:
Agriculture & Rural Development, Environment
Last updated:
apr 23, 2017
Indicators value changes by year
Minimum:
113.157
jan 1, 1976
Maximum:
292.172
jan 1, 2004
At the date of observation
Value
Absolute change
Change from previous value
jan 1, 1971
214.064
+214.064
0.0%
jan 1, 1972
216.435
+2.371
1.11%
jan 1, 1973
220.399
+3.964
1.83%
jan 1, 1974
225.098
+4.699
2.13%
jan 1, 1975
207.548
-17.55
-7.8%
jan 1, 1976
113.157
-94.392
-45.48%
jan 1, 1977
119.414
+6.257
5.53%
jan 1, 1978
134.679
+15.265
12.78%
jan 1, 1979
147.618
+12.939
9.61%
jan 1, 1980
146.857
-0.761
-0.52%
jan 1, 1981
152.755
+5.898
4.02%
jan 1, 1982
160.544
+7.79
5.1%
jan 1, 1983
169.843
+9.299
5.79%
jan 1, 1984
180.922
+11.079
6.52%
jan 1, 1985
194.122
+13.2
7.3%
jan 1, 1986
203.164
+9.042
4.66%
jan 1, 1987
202.677
-0.486
-0.24%
jan 1, 1988
209.698
+7.021
3.46%
jan 1, 1989
213.501
+3.803
1.81%
jan 1, 1990
216.776
+3.275
1.53%
jan 1, 1991
225.121
+8.344
3.85%
jan 1, 1992
232.457
+7.336
3.26%
jan 1, 1993
235.122
+2.665
1.15%
jan 1, 1994
245.057
+9.935
4.23%
jan 1, 1995
259.803
+14.746
6.02%
jan 1, 1996
260.761
+0.957
0.37%
jan 1, 1997
267.641
+6.88
2.64%
jan 1, 1998
274.469
+6.828
2.55%
jan 1, 1999
272.345
-2.124
-0.77%
jan 1, 2000
264.754
-7.591
-2.79%
jan 1, 2001
261.696
-3.058
-1.16%
jan 1, 2002
268.483
+6.787
2.59%
jan 1, 2003
285.691
+17.207
6.41%
jan 1, 2004
292.172
+6.481
2.27%
jan 1, 2005
285.833
-6.339
-2.17%
jan 1, 2006
271.063
-14.77
-5.17%
jan 1, 2007
259.628
-11.435
-4.22%
jan 1, 2008
244.844
-14.783
-5.69%
jan 1, 2009
231.743
-13.101
-5.35%
Ranking of countries by current statistics by years


Comments: