29
/
en
AIzaSyAYiBZKx7MnpbEhh9jyipgxe19OcubqV5w
April 1, 2024
108234
Comoros
COM
true
2
1
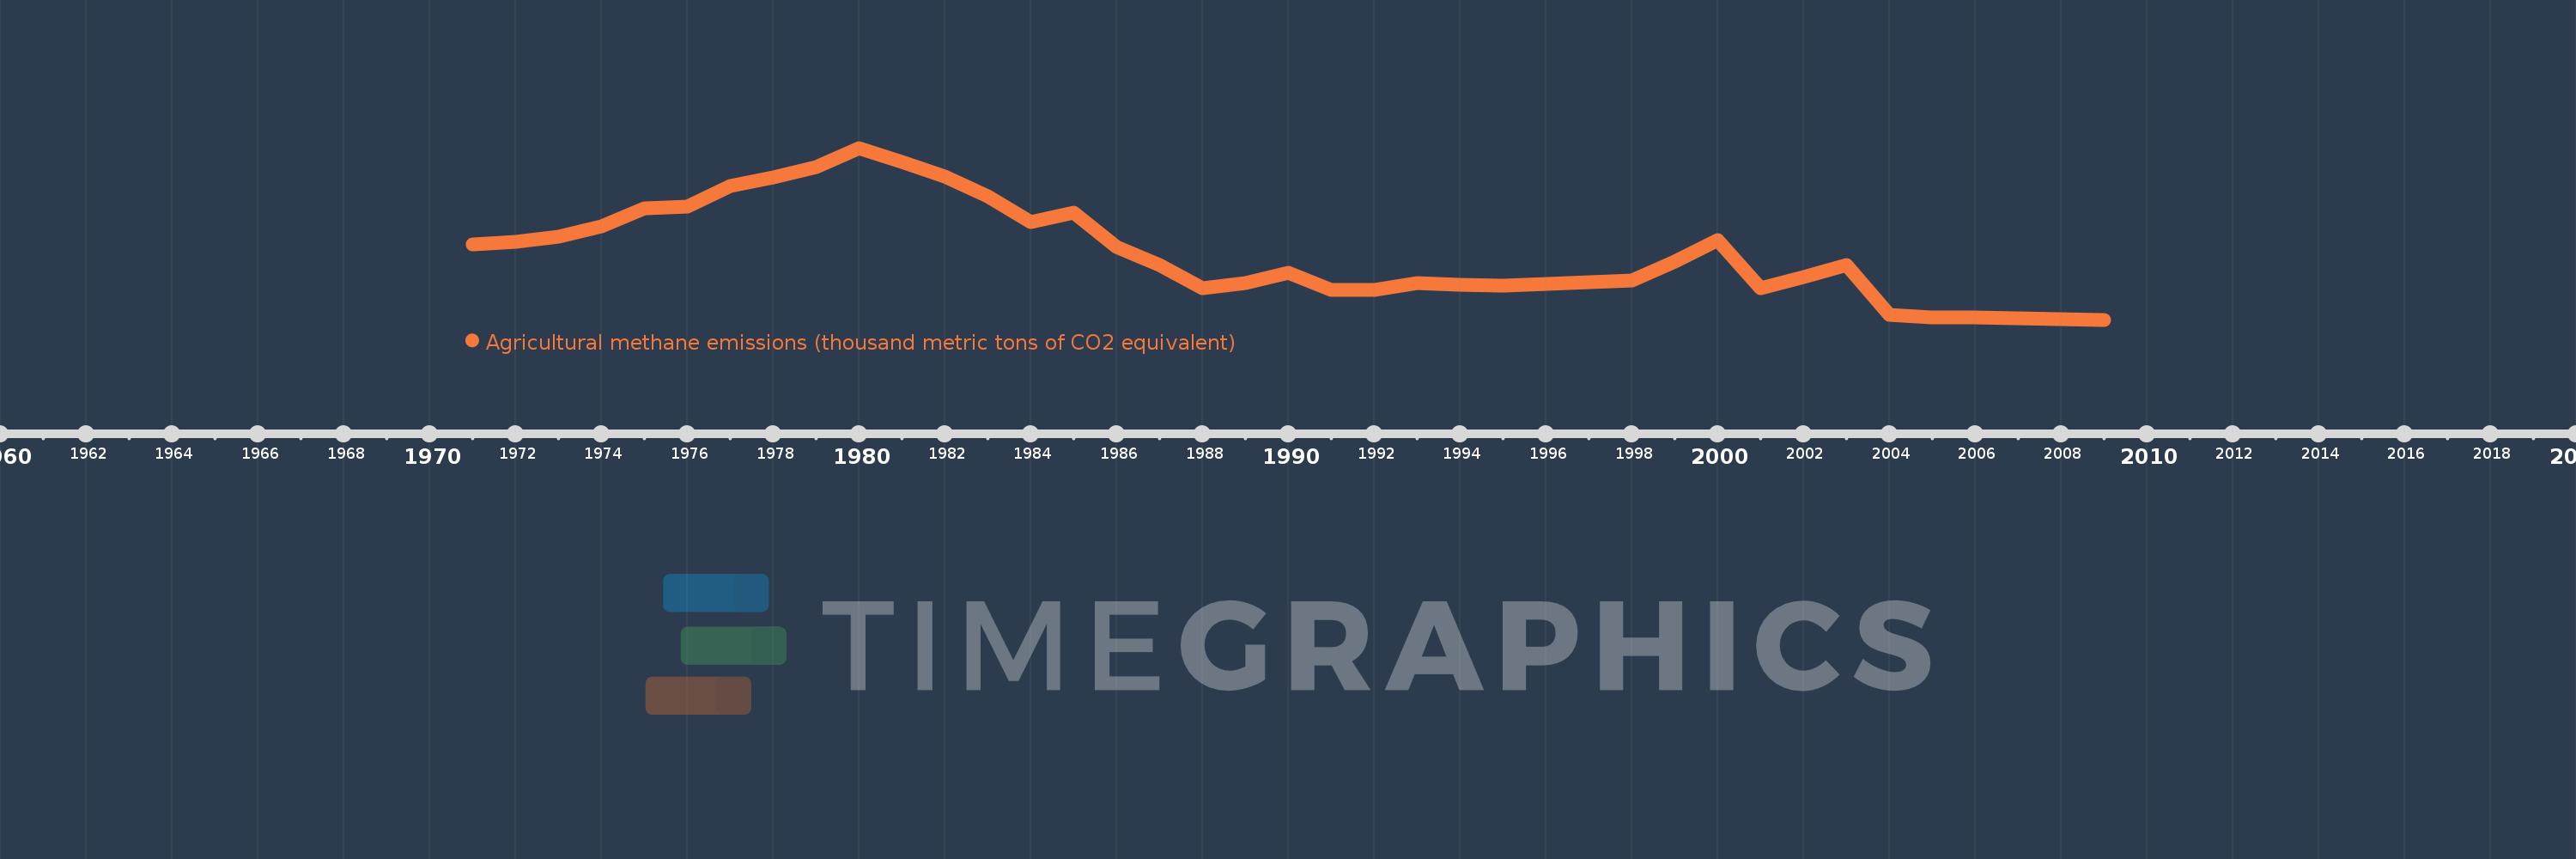
Agricultural methane emissions (thousand metric tons of CO2 equivalent)
2009,2008,2007,2006,2005,2004,2003,2002,2001,2000,1999,1998,1997,1996,1995,1994,1993,1992,1991,1990,1989,1988,1987,1986,1985,1984,1983,1982,1981,1980,1979,1978,1977,1976,1975,1974,1973,1972,1971
This statistics in other country:
AfghanistanAlbaniaAlgeriaAmerican SamoaAndorraAngolaAntigua and BarbudaArab WorldArgentinaArmeniaArubaAustraliaAustriaAzerbaijanBahamas, TheBahrainBangladeshBarbadosBelarusBelgiumBelizeBeninBermudaBhutanBoliviaBosnia and HerzegovinaBotswanaBrazilBritish Virgin IslandsBrunei DarussalamBulgariaBurkina FasoBurundiCabo VerdeCambodiaCameroonCanadaCaribbean small statesCayman IslandsCentral African RepublicCentral Europe and the BalticsChadChannel IslandsChileChinaColombiaComorosCongo, Dem. Rep.Congo, Rep.Costa RicaCote d'IvoireCroatiaCubaCuracaoCyprusCzech RepublicDenmarkDjiboutiDominicaDominican RepublicEarly-demographic dividendEast Asia & PacificEast Asia & Pacific (excluding high income)East Asia & Pacific (IDA & IBRD countries)EcuadorEgypt, Arab Rep.El SalvadorEquatorial GuineaEritreaEstoniaEthiopiaEuro areaEurope & Central AsiaEurope & Central Asia (excluding high income)Europe & Central Asia (IDA & IBRD countries)European UnionFaroe IslandsFijiFinlandFragile and conflict affected situationsFranceFrench PolynesiaGabonGambia, TheGeorgiaGermanyGhanaGibraltarGreeceGreenlandGrenadaGuamGuatemalaGuineaGuinea-BissauGuyanaHaitiHeavily indebted poor countries (HIPC)High incomeHondurasHong Kong SAR, ChinaHungaryIBRD onlyIcelandIDA & IBRD totalIDA blendIDA onlyIDA totalIndiaIndonesiaIran, Islamic Rep.IraqIrelandIsle of ManIsraelItalyJamaicaJapanJordanKazakhstanKenyaKiribatiKorea, Dem. People’s Rep.Korea, Rep.KosovoKuwaitKyrgyz RepublicLao PDRLate-demographic dividendLatin America & Caribbean Latin America & Caribbean (excluding high income)Latin America & the Caribbean (IDA & IBRD countries)LatviaLeast developed countries: UN classificationLebanonLesothoLiberiaLibyaLiechtensteinLithuaniaLow & middle incomeLow incomeLower middle incomeLuxembourgMacao SAR, ChinaMacedonia, FYRMadagascarMalawiMalaysiaMaldivesMaliMaltaMarshall IslandsMauritaniaMauritiusMexicoMicronesia, Fed. Sts.Middle East & North AfricaMiddle East & North Africa (excluding high income)Middle East & North Africa (IDA & IBRD countries)Middle incomeMoldovaMonacoMongoliaMontenegroMoroccoMozambiqueMyanmarNamibiaNauruNepalNetherlandsNew CaledoniaNew ZealandNicaraguaNigerNigeriaNorth AmericaNorthern Mariana IslandsNorwayOECD membersOmanOther small statesPacific island small statesPakistanPalauPanamaPapua New GuineaParaguayPeruPhilippinesPolandPortugalPost-demographic dividendPre-demographic dividendPuerto RicoQatarRomaniaRussian FederationRwandaSamoaSan MarinoSao Tome and PrincipeSaudi ArabiaSenegalSerbiaSeychellesSierra LeoneSingaporeSint Maarten (Dutch part)Slovak RepublicSloveniaSmall statesSolomon IslandsSomaliaSouth AfricaSouth AsiaSouth Asia (IDA & IBRD)South SudanSpainSri LankaSt. Kitts and NevisSt. LuciaSt. Martin (French part)St. Vincent and the GrenadinesSub-Saharan Africa Sub-Saharan Africa (excluding high income)Sub-Saharan Africa (IDA & IBRD countries)SudanSurinameSwazilandSwedenSwitzerlandSyrian Arab RepublicTajikistanTanzaniaThailandTimor-LesteTogoTongaTrinidad and TobagoTunisiaTurkeyTurkmenistanTurks and Caicos IslandsTuvaluUgandaUkraineUnited Arab EmiratesUnited KingdomUnited StatesUpper middle incomeUruguayUzbekistanVanuatuVenezuela, RBVietnamVirgin Islands (U.S.)West Bank and GazaWorldYemen, Rep.ZambiaZimbabwe Timeline:
This timeline shows a graph from 1971 to 2009 of Comoros. No data until 1970. Number of actual observations by date: 39.
Source name:
World Development Indicators
Source organization:
European Commission, Joint Research Centre (JRC)/Netherlands Environmental Assessment Agency (PBL). Emission Database for Global Atmospheric Research (EDGAR): http://edgar.jrc.ec.europa.eu/
Categories, topics:
Agriculture & Rural Development, Environment
Last updated:
apr 23, 2017
Indicators value changes by year
Minimum:
85.195
jan 1, 2009
Maximum:
107.104
jan 1, 1980
At the date of observation
Value
Absolute change
Change from previous value
jan 1, 1971
94.856
+94.856
0.0%
jan 1, 1972
95.094
+0.238
0.25%
jan 1, 1973
95.788
+0.694
0.73%
jan 1, 1974
97.119
+1.331
1.39%
jan 1, 1975
99.379
+2.26
2.33%
jan 1, 1976
99.598
+0.219
0.22%
jan 1, 1977
102.279
+2.68
2.69%
jan 1, 1978
103.317
+1.038
1.02%
jan 1, 1979
104.616
+1.299
1.26%
jan 1, 1980
107.104
+2.488
2.38%
jan 1, 1981
105.314
-1.79
-1.67%
jan 1, 1982
103.412
-1.901
-1.81%
jan 1, 1983
100.968
-2.445
-2.36%
jan 1, 1984
97.609
-3.359
-3.33%
jan 1, 1985
98.892
+1.283
1.31%
jan 1, 1986
94.465
-4.427
-4.48%
jan 1, 1987
92.223
-2.242
-2.37%
jan 1, 1988
89.172
-3.051
-3.31%
jan 1, 1989
89.892
+0.72
0.81%
jan 1, 1990
91.19
+1.297
1.44%
jan 1, 1991
89.045
-2.145
-2.35%
jan 1, 1992
88.981
-0.064
-0.07%
jan 1, 1993
89.849
+0.867
0.97%
jan 1, 1994
89.671
-0.177
-0.2%
jan 1, 1995
89.56
-0.111
-0.12%
jan 1, 1996
89.735
+0.175
0.19%
jan 1, 1997
89.975
+0.24
0.27%
jan 1, 1998
90.15
+0.175
0.19%
jan 1, 1999
92.582
+2.432
2.7%
jan 1, 2000
95.402
+2.82
3.05%
jan 1, 2001
89.262
-6.14
-6.44%
jan 1, 2002
90.657
+1.395
1.56%
jan 1, 2003
92.196
+1.539
1.7%
jan 1, 2004
85.784
-6.412
-6.95%
jan 1, 2005
85.512
-0.273
-0.32%
jan 1, 2006
85.512
0.0
0.0%
jan 1, 2007
85.365
-0.147
-0.17%
jan 1, 2008
85.297
-0.068
-0.08%
jan 1, 2009
85.195
-0.102
-0.12%
Ranking of countries by current statistics by years


Comments: