29
/
en
AIzaSyAYiBZKx7MnpbEhh9jyipgxe19OcubqV5w
April 1, 2024
226583
Puerto Rico
PRI
true
2
1
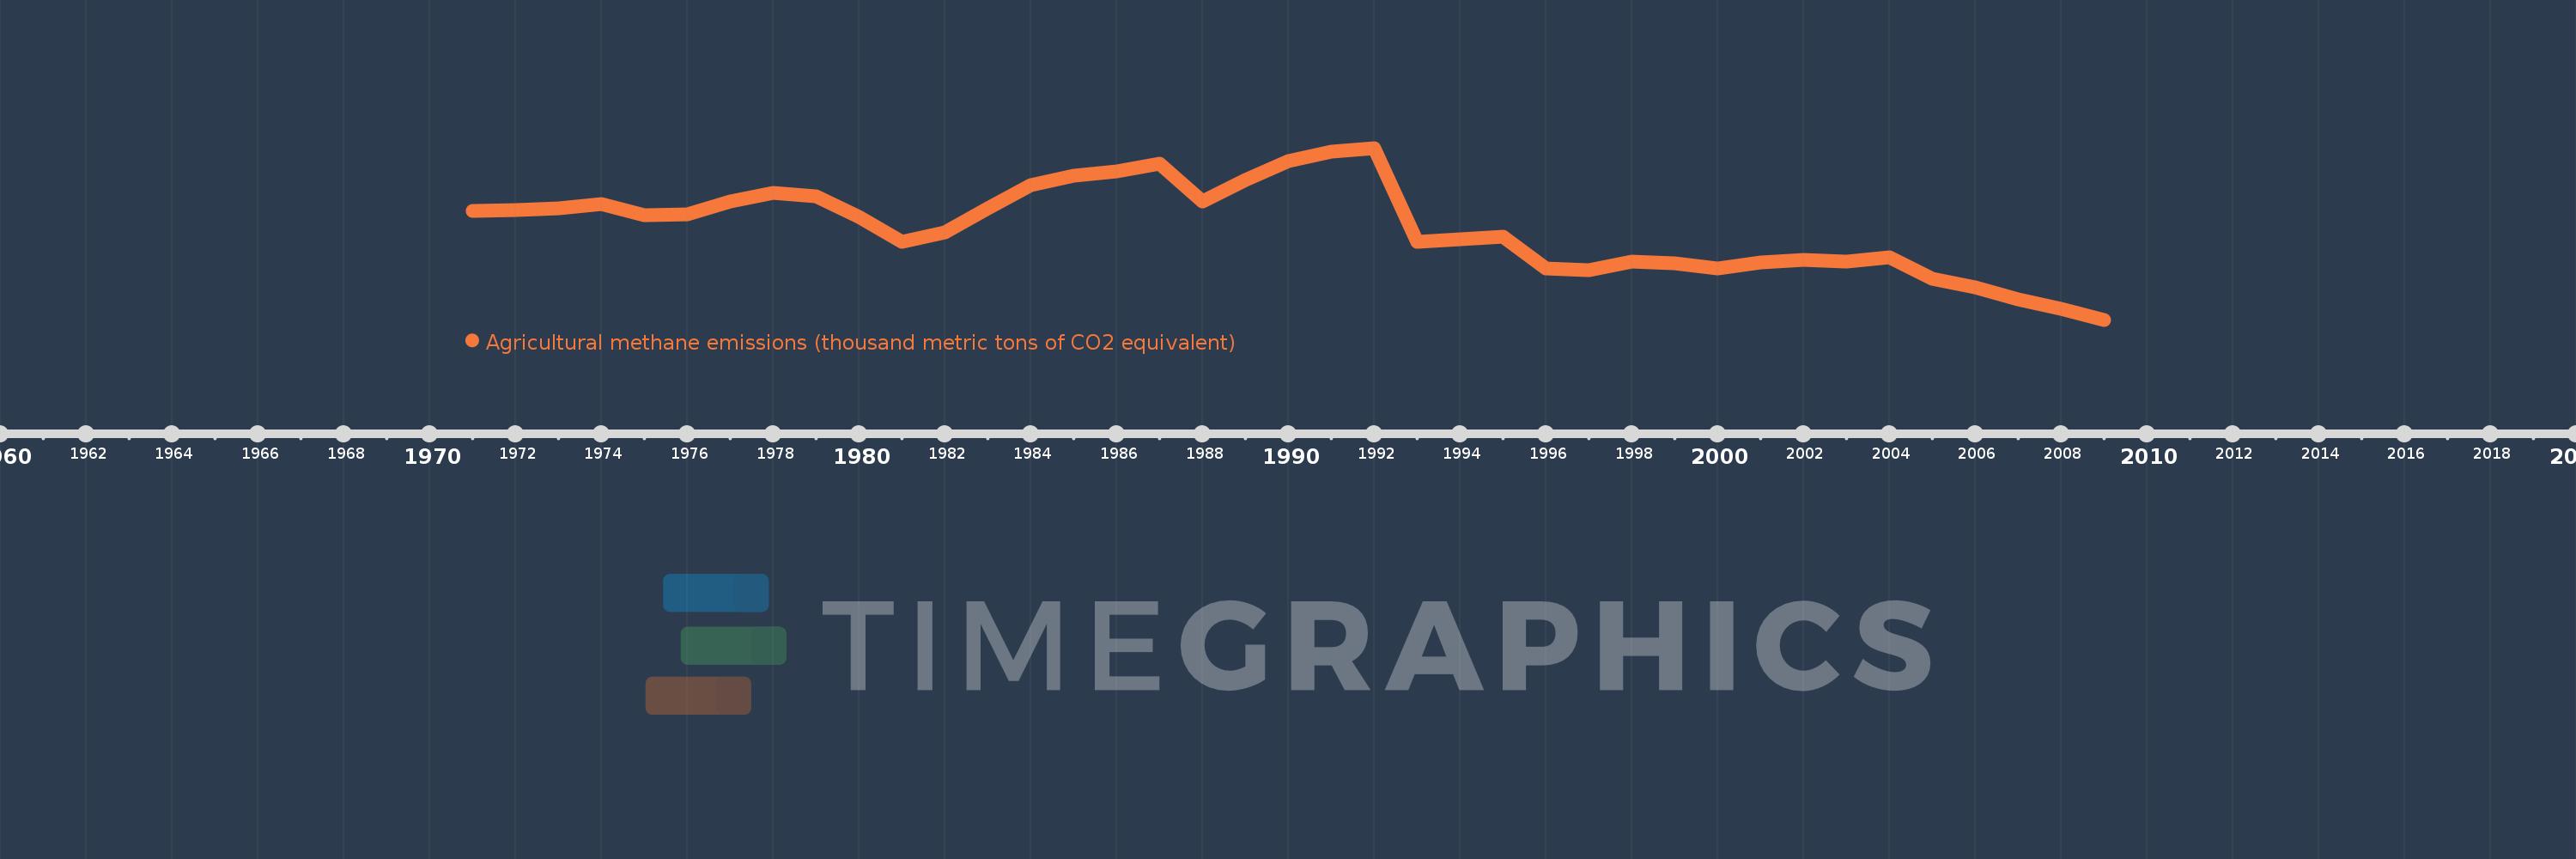
Agricultural methane emissions (thousand metric tons of CO2 equivalent)
2009,2008,2007,2006,2005,2004,2003,2002,2001,2000,1999,1998,1997,1996,1995,1994,1993,1992,1991,1990,1989,1988,1987,1986,1985,1984,1983,1982,1981,1980,1979,1978,1977,1976,1975,1974,1973,1972,1971
This statistics in other country:
AfghanistanAlbaniaAlgeriaAmerican SamoaAndorraAngolaAntigua and BarbudaArab WorldArgentinaArmeniaArubaAustraliaAustriaAzerbaijanBahamas, TheBahrainBangladeshBarbadosBelarusBelgiumBelizeBeninBermudaBhutanBoliviaBosnia and HerzegovinaBotswanaBrazilBritish Virgin IslandsBrunei DarussalamBulgariaBurkina FasoBurundiCabo VerdeCambodiaCameroonCanadaCaribbean small statesCayman IslandsCentral African RepublicCentral Europe and the BalticsChadChannel IslandsChileChinaColombiaComorosCongo, Dem. Rep.Congo, Rep.Costa RicaCote d'IvoireCroatiaCubaCuracaoCyprusCzech RepublicDenmarkDjiboutiDominicaDominican RepublicEarly-demographic dividendEast Asia & PacificEast Asia & Pacific (excluding high income)East Asia & Pacific (IDA & IBRD countries)EcuadorEgypt, Arab Rep.El SalvadorEquatorial GuineaEritreaEstoniaEthiopiaEuro areaEurope & Central AsiaEurope & Central Asia (excluding high income)Europe & Central Asia (IDA & IBRD countries)European UnionFaroe IslandsFijiFinlandFragile and conflict affected situationsFranceFrench PolynesiaGabonGambia, TheGeorgiaGermanyGhanaGibraltarGreeceGreenlandGrenadaGuamGuatemalaGuineaGuinea-BissauGuyanaHaitiHeavily indebted poor countries (HIPC)High incomeHondurasHong Kong SAR, ChinaHungaryIBRD onlyIcelandIDA & IBRD totalIDA blendIDA onlyIDA totalIndiaIndonesiaIran, Islamic Rep.IraqIrelandIsle of ManIsraelItalyJamaicaJapanJordanKazakhstanKenyaKiribatiKorea, Dem. People’s Rep.Korea, Rep.KosovoKuwaitKyrgyz RepublicLao PDRLate-demographic dividendLatin America & Caribbean Latin America & Caribbean (excluding high income)Latin America & the Caribbean (IDA & IBRD countries)LatviaLeast developed countries: UN classificationLebanonLesothoLiberiaLibyaLiechtensteinLithuaniaLow & middle incomeLow incomeLower middle incomeLuxembourgMacao SAR, ChinaMacedonia, FYRMadagascarMalawiMalaysiaMaldivesMaliMaltaMarshall IslandsMauritaniaMauritiusMexicoMicronesia, Fed. Sts.Middle East & North AfricaMiddle East & North Africa (excluding high income)Middle East & North Africa (IDA & IBRD countries)Middle incomeMoldovaMonacoMongoliaMontenegroMoroccoMozambiqueMyanmarNamibiaNauruNepalNetherlandsNew CaledoniaNew ZealandNicaraguaNigerNigeriaNorth AmericaNorthern Mariana IslandsNorwayOECD membersOmanOther small statesPacific island small statesPakistanPalauPanamaPapua New GuineaParaguayPeruPhilippinesPolandPortugalPost-demographic dividendPre-demographic dividendPuerto RicoQatarRomaniaRussian FederationRwandaSamoaSan MarinoSao Tome and PrincipeSaudi ArabiaSenegalSerbiaSeychellesSierra LeoneSingaporeSint Maarten (Dutch part)Slovak RepublicSloveniaSmall statesSolomon IslandsSomaliaSouth AfricaSouth AsiaSouth Asia (IDA & IBRD)South SudanSpainSri LankaSt. Kitts and NevisSt. LuciaSt. Martin (French part)St. Vincent and the GrenadinesSub-Saharan Africa Sub-Saharan Africa (excluding high income)Sub-Saharan Africa (IDA & IBRD countries)SudanSurinameSwazilandSwedenSwitzerlandSyrian Arab RepublicTajikistanTanzaniaThailandTimor-LesteTogoTongaTrinidad and TobagoTunisiaTurkeyTurkmenistanTurks and Caicos IslandsTuvaluUgandaUkraineUnited Arab EmiratesUnited KingdomUnited StatesUpper middle incomeUruguayUzbekistanVanuatuVenezuela, RBVietnamVirgin Islands (U.S.)West Bank and GazaWorldYemen, Rep.ZambiaZimbabwe Timeline:
This timeline shows a graph from 1971 to 2009 of Puerto Rico. No data until 1970. Number of actual observations by date: 39.
Source name:
World Development Indicators
Source organization:
European Commission, Joint Research Centre (JRC)/Netherlands Environmental Assessment Agency (PBL). Emission Database for Global Atmospheric Research (EDGAR): http://edgar.jrc.ec.europa.eu/
Categories, topics:
Agriculture & Rural Development, Environment
Last updated:
apr 23, 2017
Indicators value changes by year
Minimum:
485.501
jan 1, 2009
Maximum:
861.426
jan 1, 1992
At the date of observation
Value
Absolute change
Change from previous value
jan 1, 1971
724.135
+724.135
0.0%
jan 1, 1972
725.305
+1.17
0.16%
jan 1, 1973
730.217
+4.912
0.68%
jan 1, 1974
738.122
+7.905
1.08%
jan 1, 1975
714.926
-23.197
-3.14%
jan 1, 1976
716.273
+1.348
0.19%
jan 1, 1977
744.018
+27.745
3.87%
jan 1, 1978
763.736
+19.717
2.65%
jan 1, 1979
754.914
-8.821
-1.15%
jan 1, 1980
711.291
-43.623
-5.78%
jan 1, 1981
655.879
-55.412
-7.79%
jan 1, 1982
676.338
+20.459
3.12%
jan 1, 1983
728.866
+52.528
7.77%
jan 1, 1984
780.056
+51.191
7.02%
jan 1, 1985
800.735
+20.678
2.65%
jan 1, 1986
809.951
+9.216
1.15%
jan 1, 1987
827.314
+17.363
2.14%
jan 1, 1988
743.424
-83.89
-10.14%
jan 1, 1989
790.809
+47.385
6.37%
jan 1, 1990
831.918
+41.109
5.2%
jan 1, 1991
853.701
+21.782
2.62%
jan 1, 1992
861.426
+7.726
0.9%
jan 1, 1993
656.694
-204.732
-23.77%
jan 1, 1994
662.158
+5.464
0.83%
jan 1, 1995
667.523
+5.364
0.81%
jan 1, 1996
598.27
-69.252
-10.37%
jan 1, 1997
593.999
-4.272
-0.71%
jan 1, 1998
612.676
+18.678
3.14%
jan 1, 1999
609.09
-3.586
-0.59%
jan 1, 2000
597.121
-11.969
-1.97%
jan 1, 2001
611.531
+14.41
2.41%
jan 1, 2002
615.735
+4.204
0.69%
jan 1, 2003
613.661
-2.074
-0.34%
jan 1, 2004
621.389
+7.728
1.26%
jan 1, 2005
574.303
-47.086
-7.58%
jan 1, 2006
556.836
-17.467
-3.04%
jan 1, 2007
529.992
-26.844
-4.82%
jan 1, 2008
509.28
-20.712
-3.91%
jan 1, 2009
485.501
-23.779
-4.67%
Ranking of countries by current statistics by years


Comments: