29
/
en
AIzaSyAYiBZKx7MnpbEhh9jyipgxe19OcubqV5w
April 1, 2024
143720
Guam
GUM
true
2
1
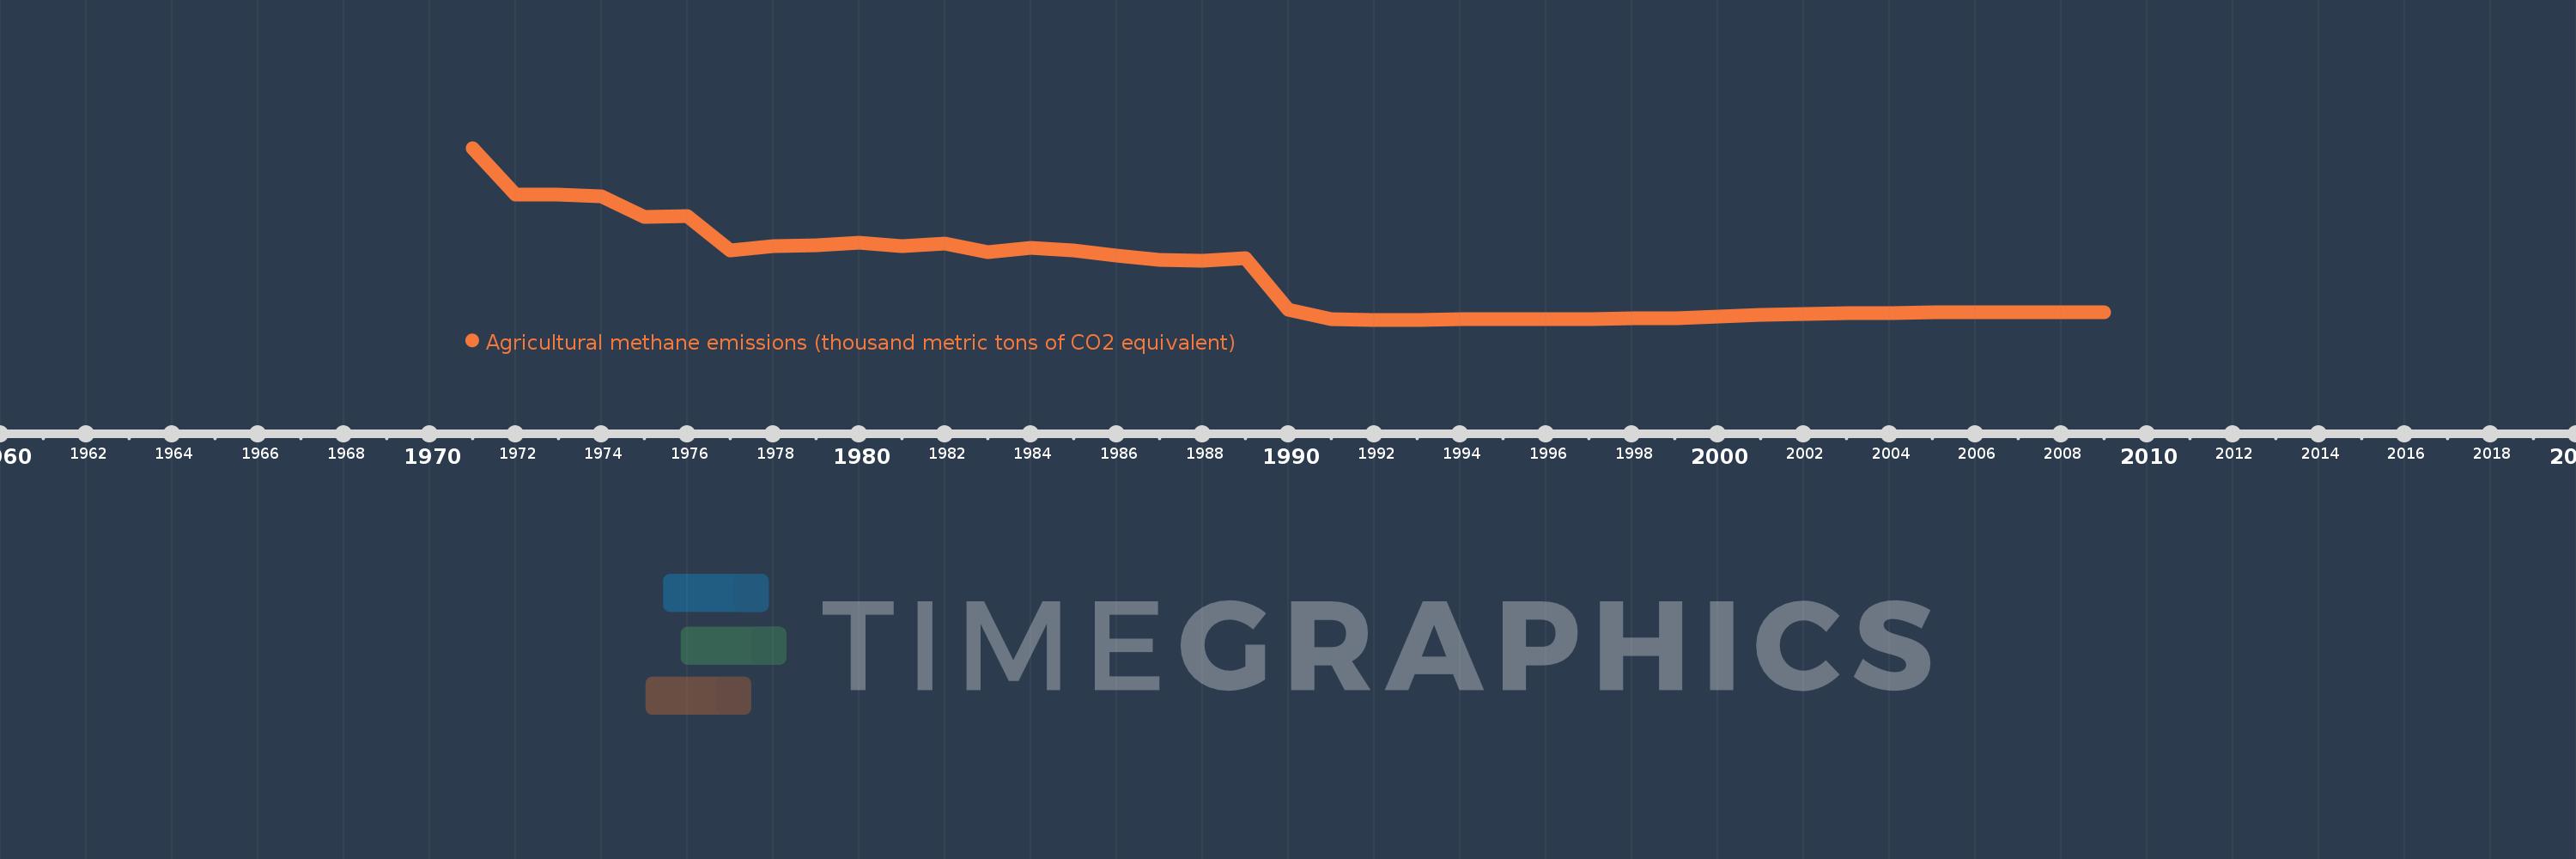
Agricultural methane emissions (thousand metric tons of CO2 equivalent)
2009,2008,2007,2006,2005,2004,2003,2002,2001,2000,1999,1998,1997,1996,1995,1994,1993,1992,1991,1990,1989,1988,1987,1986,1985,1984,1983,1982,1981,1980,1979,1978,1977,1976,1975,1974,1973,1972,1971
This statistics in other country:
AfghanistanAlbaniaAlgeriaAmerican SamoaAndorraAngolaAntigua and BarbudaArab WorldArgentinaArmeniaArubaAustraliaAustriaAzerbaijanBahamas, TheBahrainBangladeshBarbadosBelarusBelgiumBelizeBeninBermudaBhutanBoliviaBosnia and HerzegovinaBotswanaBrazilBritish Virgin IslandsBrunei DarussalamBulgariaBurkina FasoBurundiCabo VerdeCambodiaCameroonCanadaCaribbean small statesCayman IslandsCentral African RepublicCentral Europe and the BalticsChadChannel IslandsChileChinaColombiaComorosCongo, Dem. Rep.Congo, Rep.Costa RicaCote d'IvoireCroatiaCubaCuracaoCyprusCzech RepublicDenmarkDjiboutiDominicaDominican RepublicEarly-demographic dividendEast Asia & PacificEast Asia & Pacific (excluding high income)East Asia & Pacific (IDA & IBRD countries)EcuadorEgypt, Arab Rep.El SalvadorEquatorial GuineaEritreaEstoniaEthiopiaEuro areaEurope & Central AsiaEurope & Central Asia (excluding high income)Europe & Central Asia (IDA & IBRD countries)European UnionFaroe IslandsFijiFinlandFragile and conflict affected situationsFranceFrench PolynesiaGabonGambia, TheGeorgiaGermanyGhanaGibraltarGreeceGreenlandGrenadaGuamGuatemalaGuineaGuinea-BissauGuyanaHaitiHeavily indebted poor countries (HIPC)High incomeHondurasHong Kong SAR, ChinaHungaryIBRD onlyIcelandIDA & IBRD totalIDA blendIDA onlyIDA totalIndiaIndonesiaIran, Islamic Rep.IraqIrelandIsle of ManIsraelItalyJamaicaJapanJordanKazakhstanKenyaKiribatiKorea, Dem. People’s Rep.Korea, Rep.KosovoKuwaitKyrgyz RepublicLao PDRLate-demographic dividendLatin America & Caribbean Latin America & Caribbean (excluding high income)Latin America & the Caribbean (IDA & IBRD countries)LatviaLeast developed countries: UN classificationLebanonLesothoLiberiaLibyaLiechtensteinLithuaniaLow & middle incomeLow incomeLower middle incomeLuxembourgMacao SAR, ChinaMacedonia, FYRMadagascarMalawiMalaysiaMaldivesMaliMaltaMarshall IslandsMauritaniaMauritiusMexicoMicronesia, Fed. Sts.Middle East & North AfricaMiddle East & North Africa (excluding high income)Middle East & North Africa (IDA & IBRD countries)Middle incomeMoldovaMonacoMongoliaMontenegroMoroccoMozambiqueMyanmarNamibiaNauruNepalNetherlandsNew CaledoniaNew ZealandNicaraguaNigerNigeriaNorth AmericaNorthern Mariana IslandsNorwayOECD membersOmanOther small statesPacific island small statesPakistanPalauPanamaPapua New GuineaParaguayPeruPhilippinesPolandPortugalPost-demographic dividendPre-demographic dividendPuerto RicoQatarRomaniaRussian FederationRwandaSamoaSan MarinoSao Tome and PrincipeSaudi ArabiaSenegalSerbiaSeychellesSierra LeoneSingaporeSint Maarten (Dutch part)Slovak RepublicSloveniaSmall statesSolomon IslandsSomaliaSouth AfricaSouth AsiaSouth Asia (IDA & IBRD)South SudanSpainSri LankaSt. Kitts and NevisSt. LuciaSt. Martin (French part)St. Vincent and the GrenadinesSub-Saharan Africa Sub-Saharan Africa (excluding high income)Sub-Saharan Africa (IDA & IBRD countries)SudanSurinameSwazilandSwedenSwitzerlandSyrian Arab RepublicTajikistanTanzaniaThailandTimor-LesteTogoTongaTrinidad and TobagoTunisiaTurkeyTurkmenistanTurks and Caicos IslandsTuvaluUgandaUkraineUnited Arab EmiratesUnited KingdomUnited StatesUpper middle incomeUruguayUzbekistanVanuatuVenezuela, RBVietnamVirgin Islands (U.S.)West Bank and GazaWorldYemen, Rep.ZambiaZimbabwe Timeline:
This timeline shows a graph from 1971 to 2009 of Guam. No data until 1970. Number of actual observations by date: 39.
Source name:
World Development Indicators
Source organization:
European Commission, Joint Research Centre (JRC)/Netherlands Environmental Assessment Agency (PBL). Emission Database for Global Atmospheric Research (EDGAR): http://edgar.jrc.ec.europa.eu/
Categories, topics:
Agriculture & Rural Development, Environment
Last updated:
apr 23, 2017
Indicators value changes by year
Maximum:
10.121
jan 1, 1971
At the date of observation
Value
Absolute change
Change from previous value
jan 1, 1971
10.121
+10.121
0.0%
jan 1, 1972
7.739
-2.383
-23.54%
jan 1, 1973
7.763
+0.025
0.32%
jan 1, 1974
7.665
-0.098
-1.27%
jan 1, 1975
6.63
-1.035
-13.51%
jan 1, 1976
6.656
+0.026
0.39%
jan 1, 1977
4.919
-1.736
-26.09%
jan 1, 1978
5.134
+0.215
4.37%
jan 1, 1979
5.19
+0.056
1.09%
jan 1, 1980
5.297
+0.106
2.05%
jan 1, 1981
5.139
-0.158
-2.98%
jan 1, 1982
5.277
+0.138
2.68%
jan 1, 1983
4.81
-0.467
-8.85%
jan 1, 1984
5.047
+0.237
4.94%
jan 1, 1985
4.913
-0.134
-2.65%
jan 1, 1986
4.628
-0.285
-5.8%
jan 1, 1987
4.453
-0.175
-3.78%
jan 1, 1988
4.383
-0.07
-1.57%
jan 1, 1989
4.497
+0.113
2.59%
jan 1, 1990
1.909
-2.588
-57.55%
jan 1, 1991
1.403
-0.506
-26.52%
jan 1, 1992
1.388
-0.015
-1.04%
jan 1, 1993
1.396
+0.008
0.55%
jan 1, 1994
1.402
+0.006
0.46%
jan 1, 1995
1.401
-0.001
-0.07%
jan 1, 1996
1.4
-0.001
-0.07%
jan 1, 1997
1.401
+0.001
0.08%
jan 1, 1998
1.457
+0.055
3.94%
jan 1, 1999
1.458
+0.001
0.07%
jan 1, 2000
1.54
+0.082
5.65%
jan 1, 2001
1.622
+0.082
5.35%
jan 1, 2002
1.679
+0.057
3.52%
jan 1, 2003
1.735
+0.055
3.29%
jan 1, 2004
1.735
+0.001
0.05%
jan 1, 2005
1.751
+0.015
0.89%
jan 1, 2006
1.752
+0.001
0.05%
jan 1, 2007
1.759
+0.007
0.4%
jan 1, 2008
1.762
+0.004
0.21%
jan 1, 2009
1.767
+0.004
0.26%
Ranking of countries by current statistics by years


Comments: