29
/
en
AIzaSyAYiBZKx7MnpbEhh9jyipgxe19OcubqV5w
April 1, 2024
156962
Iran, Islamic Rep.
IRN
true
2
1
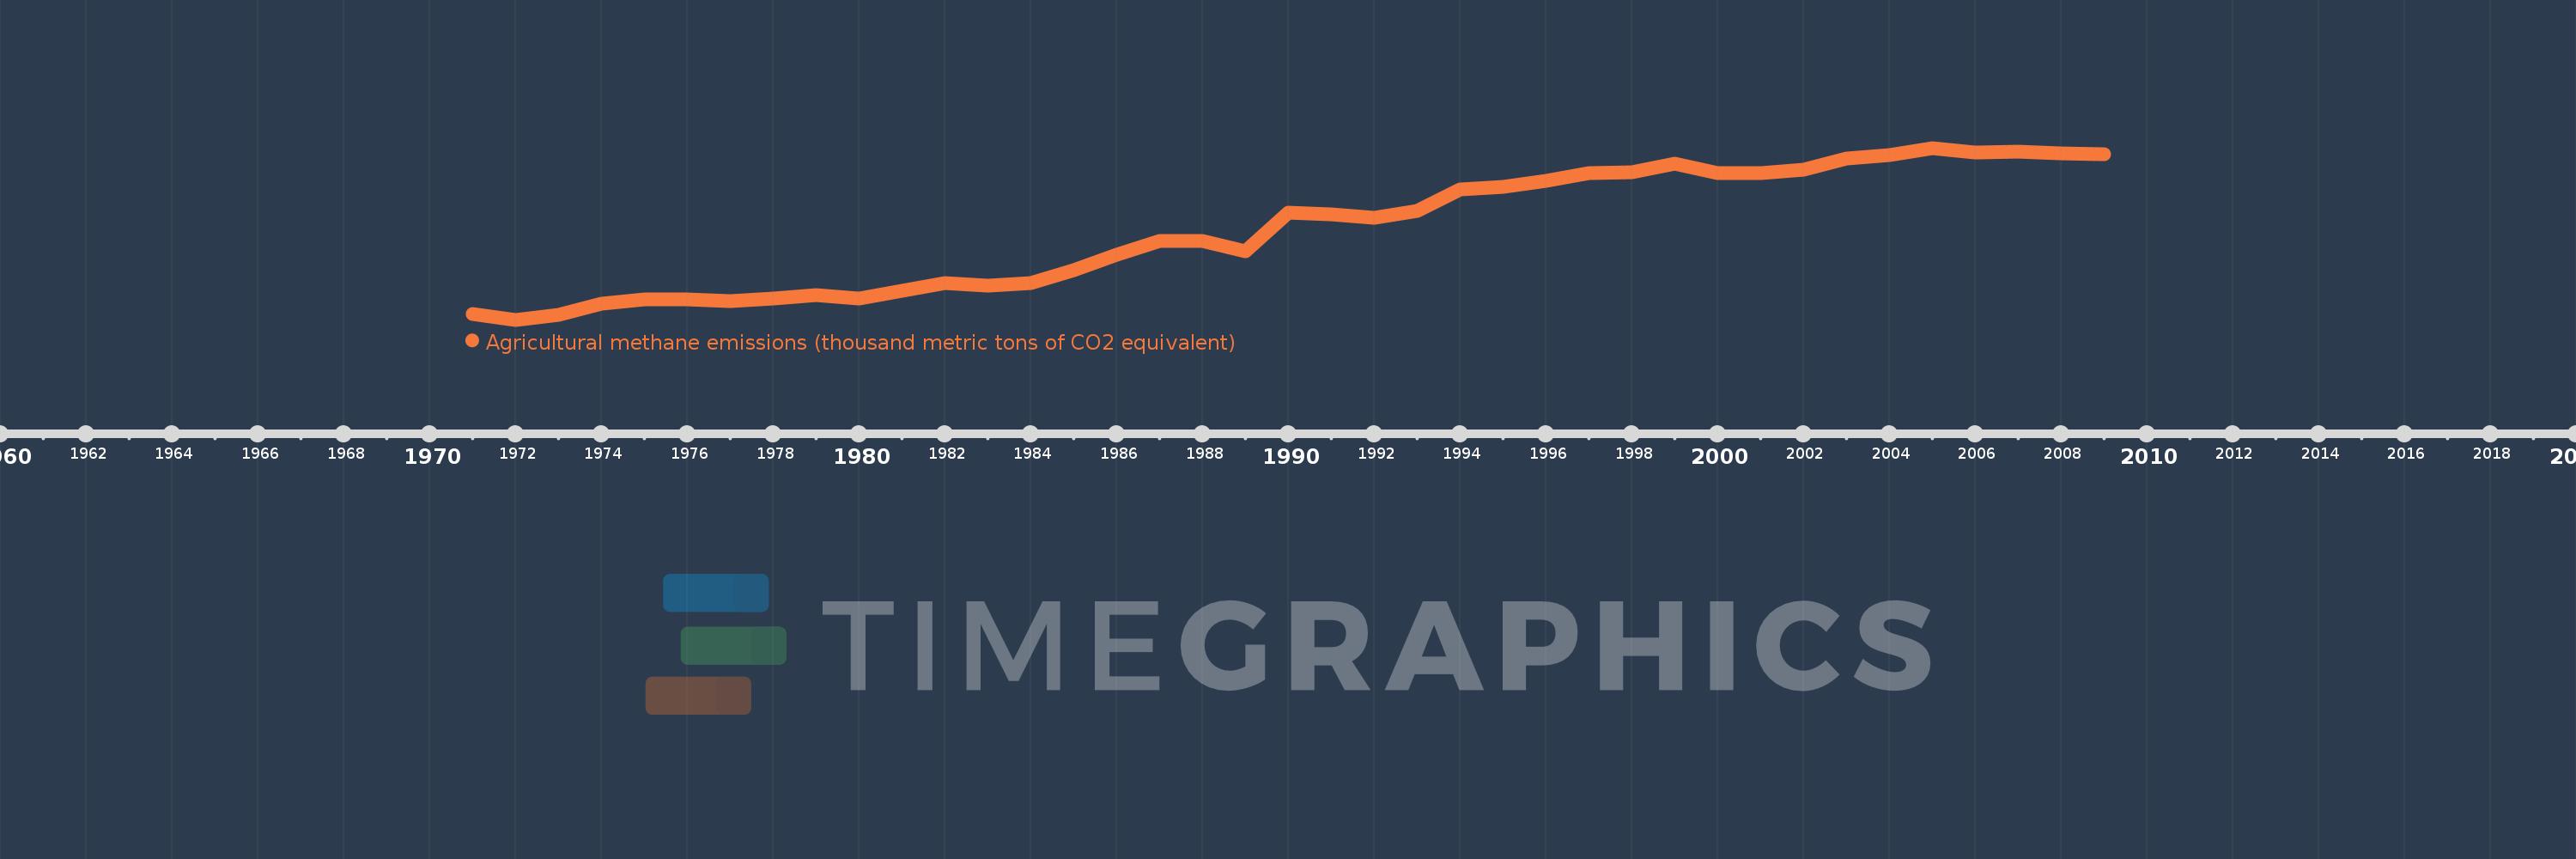
Agricultural methane emissions (thousand metric tons of CO2 equivalent)
2009,2008,2007,2006,2005,2004,2003,2002,2001,2000,1999,1998,1997,1996,1995,1994,1993,1992,1991,1990,1989,1988,1987,1986,1985,1984,1983,1982,1981,1980,1979,1978,1977,1976,1975,1974,1973,1972,1971
This statistics in other country:
AfghanistanAlbaniaAlgeriaAmerican SamoaAndorraAngolaAntigua and BarbudaArab WorldArgentinaArmeniaArubaAustraliaAustriaAzerbaijanBahamas, TheBahrainBangladeshBarbadosBelarusBelgiumBelizeBeninBermudaBhutanBoliviaBosnia and HerzegovinaBotswanaBrazilBritish Virgin IslandsBrunei DarussalamBulgariaBurkina FasoBurundiCabo VerdeCambodiaCameroonCanadaCaribbean small statesCayman IslandsCentral African RepublicCentral Europe and the BalticsChadChannel IslandsChileChinaColombiaComorosCongo, Dem. Rep.Congo, Rep.Costa RicaCote d'IvoireCroatiaCubaCuracaoCyprusCzech RepublicDenmarkDjiboutiDominicaDominican RepublicEarly-demographic dividendEast Asia & PacificEast Asia & Pacific (excluding high income)East Asia & Pacific (IDA & IBRD countries)EcuadorEgypt, Arab Rep.El SalvadorEquatorial GuineaEritreaEstoniaEthiopiaEuro areaEurope & Central AsiaEurope & Central Asia (excluding high income)Europe & Central Asia (IDA & IBRD countries)European UnionFaroe IslandsFijiFinlandFragile and conflict affected situationsFranceFrench PolynesiaGabonGambia, TheGeorgiaGermanyGhanaGibraltarGreeceGreenlandGrenadaGuamGuatemalaGuineaGuinea-BissauGuyanaHaitiHeavily indebted poor countries (HIPC)High incomeHondurasHong Kong SAR, ChinaHungaryIBRD onlyIcelandIDA & IBRD totalIDA blendIDA onlyIDA totalIndiaIndonesiaIran, Islamic Rep.IraqIrelandIsle of ManIsraelItalyJamaicaJapanJordanKazakhstanKenyaKiribatiKorea, Dem. People’s Rep.Korea, Rep.KosovoKuwaitKyrgyz RepublicLao PDRLate-demographic dividendLatin America & Caribbean Latin America & Caribbean (excluding high income)Latin America & the Caribbean (IDA & IBRD countries)LatviaLeast developed countries: UN classificationLebanonLesothoLiberiaLibyaLiechtensteinLithuaniaLow & middle incomeLow incomeLower middle incomeLuxembourgMacao SAR, ChinaMacedonia, FYRMadagascarMalawiMalaysiaMaldivesMaliMaltaMarshall IslandsMauritaniaMauritiusMexicoMicronesia, Fed. Sts.Middle East & North AfricaMiddle East & North Africa (excluding high income)Middle East & North Africa (IDA & IBRD countries)Middle incomeMoldovaMonacoMongoliaMontenegroMoroccoMozambiqueMyanmarNamibiaNauruNepalNetherlandsNew CaledoniaNew ZealandNicaraguaNigerNigeriaNorth AmericaNorthern Mariana IslandsNorwayOECD membersOmanOther small statesPacific island small statesPakistanPalauPanamaPapua New GuineaParaguayPeruPhilippinesPolandPortugalPost-demographic dividendPre-demographic dividendPuerto RicoQatarRomaniaRussian FederationRwandaSamoaSan MarinoSao Tome and PrincipeSaudi ArabiaSenegalSerbiaSeychellesSierra LeoneSingaporeSint Maarten (Dutch part)Slovak RepublicSloveniaSmall statesSolomon IslandsSomaliaSouth AfricaSouth AsiaSouth Asia (IDA & IBRD)South SudanSpainSri LankaSt. Kitts and NevisSt. LuciaSt. Martin (French part)St. Vincent and the GrenadinesSub-Saharan Africa Sub-Saharan Africa (excluding high income)Sub-Saharan Africa (IDA & IBRD countries)SudanSurinameSwazilandSwedenSwitzerlandSyrian Arab RepublicTajikistanTanzaniaThailandTimor-LesteTogoTongaTrinidad and TobagoTunisiaTurkeyTurkmenistanTurks and Caicos IslandsTuvaluUgandaUkraineUnited Arab EmiratesUnited KingdomUnited StatesUpper middle incomeUruguayUzbekistanVanuatuVenezuela, RBVietnamVirgin Islands (U.S.)West Bank and GazaWorldYemen, Rep.ZambiaZimbabwe Timeline:
This timeline shows a graph from 1971 to 2009 of Iran, Islamic Rep.. No data until 1970. Number of actual observations by date: 39.
Source name:
World Development Indicators
Source organization:
European Commission, Joint Research Centre (JRC)/Netherlands Environmental Assessment Agency (PBL). Emission Database for Global Atmospheric Research (EDGAR): http://edgar.jrc.ec.europa.eu/
Categories, topics:
Agriculture & Rural Development, Environment
Last updated:
apr 23, 2017
Indicators value changes by year
Minimum:
12.118K
jan 1, 1972
Maximum:
21.114K
jan 1, 2005
At the date of observation
Value
Absolute change
Change from previous value
jan 1, 1971
12.429K
+12.429K
0.0%
jan 1, 1972
12.118K
-311.19
-2.5%
jan 1, 1973
12.36K
+241.825
2.0%
jan 1, 1974
12.939K
+579.661
4.69%
jan 1, 1975
13.176K
+236.595
1.83%
jan 1, 1976
13.191K
+15.009
0.11%
jan 1, 1977
13.092K
-98.515
-0.75%
jan 1, 1978
13.209K
+116.68
0.89%
jan 1, 1979
13.4K
+191.435
1.45%
jan 1, 1980
13.251K
-149.501
-1.12%
jan 1, 1981
13.654K
+403.155
3.04%
jan 1, 1982
14.022K
+368.187
2.7%
jan 1, 1983
13.904K
-117.865
-0.84%
jan 1, 1984
14.05K
+145.284
1.04%
jan 1, 1985
14.7K
+649.928
4.63%
jan 1, 1986
15.508K
+808.544
5.5%
jan 1, 1987
16.24K
+731.645
4.72%
jan 1, 1988
16.24K
+0.695
0.0%
jan 1, 1989
15.709K
-531.59
-3.27%
jan 1, 1990
17.71K
+2.002K
12.74%
jan 1, 1991
17.658K
-52.303
-0.3%
jan 1, 1992
17.469K
-189.681
-1.07%
jan 1, 1993
17.799K
+330.517
1.89%
jan 1, 1994
18.933K
+1.134K
6.37%
jan 1, 1995
19.086K
+153.017
0.81%
jan 1, 1996
19.387K
+300.819
1.58%
jan 1, 1997
19.817K
+430.359
2.22%
jan 1, 1998
19.842K
+24.808
0.13%
jan 1, 1999
20.305K
+463.588
2.34%
jan 1, 2000
19.788K
-517.852
-2.55%
jan 1, 2001
19.808K
+20.274
0.1%
jan 1, 2002
19.964K
+155.932
0.79%
jan 1, 2003
20.568K
+604.504
3.03%
jan 1, 2004
20.751K
+183.076
0.89%
jan 1, 2005
21.114K
+363.012
1.75%
jan 1, 2006
20.885K
-229.565
-1.09%
jan 1, 2007
20.92K
+35.572
0.17%
jan 1, 2008
20.814K
-106.648
-0.51%
jan 1, 2009
20.778K
-35.596
-0.17%
Ranking of countries by current statistics by years


Comments: