29
/
en
AIzaSyAYiBZKx7MnpbEhh9jyipgxe19OcubqV5w
April 1, 2024
55745
Pre-demographic dividend
PRE
false
2
1
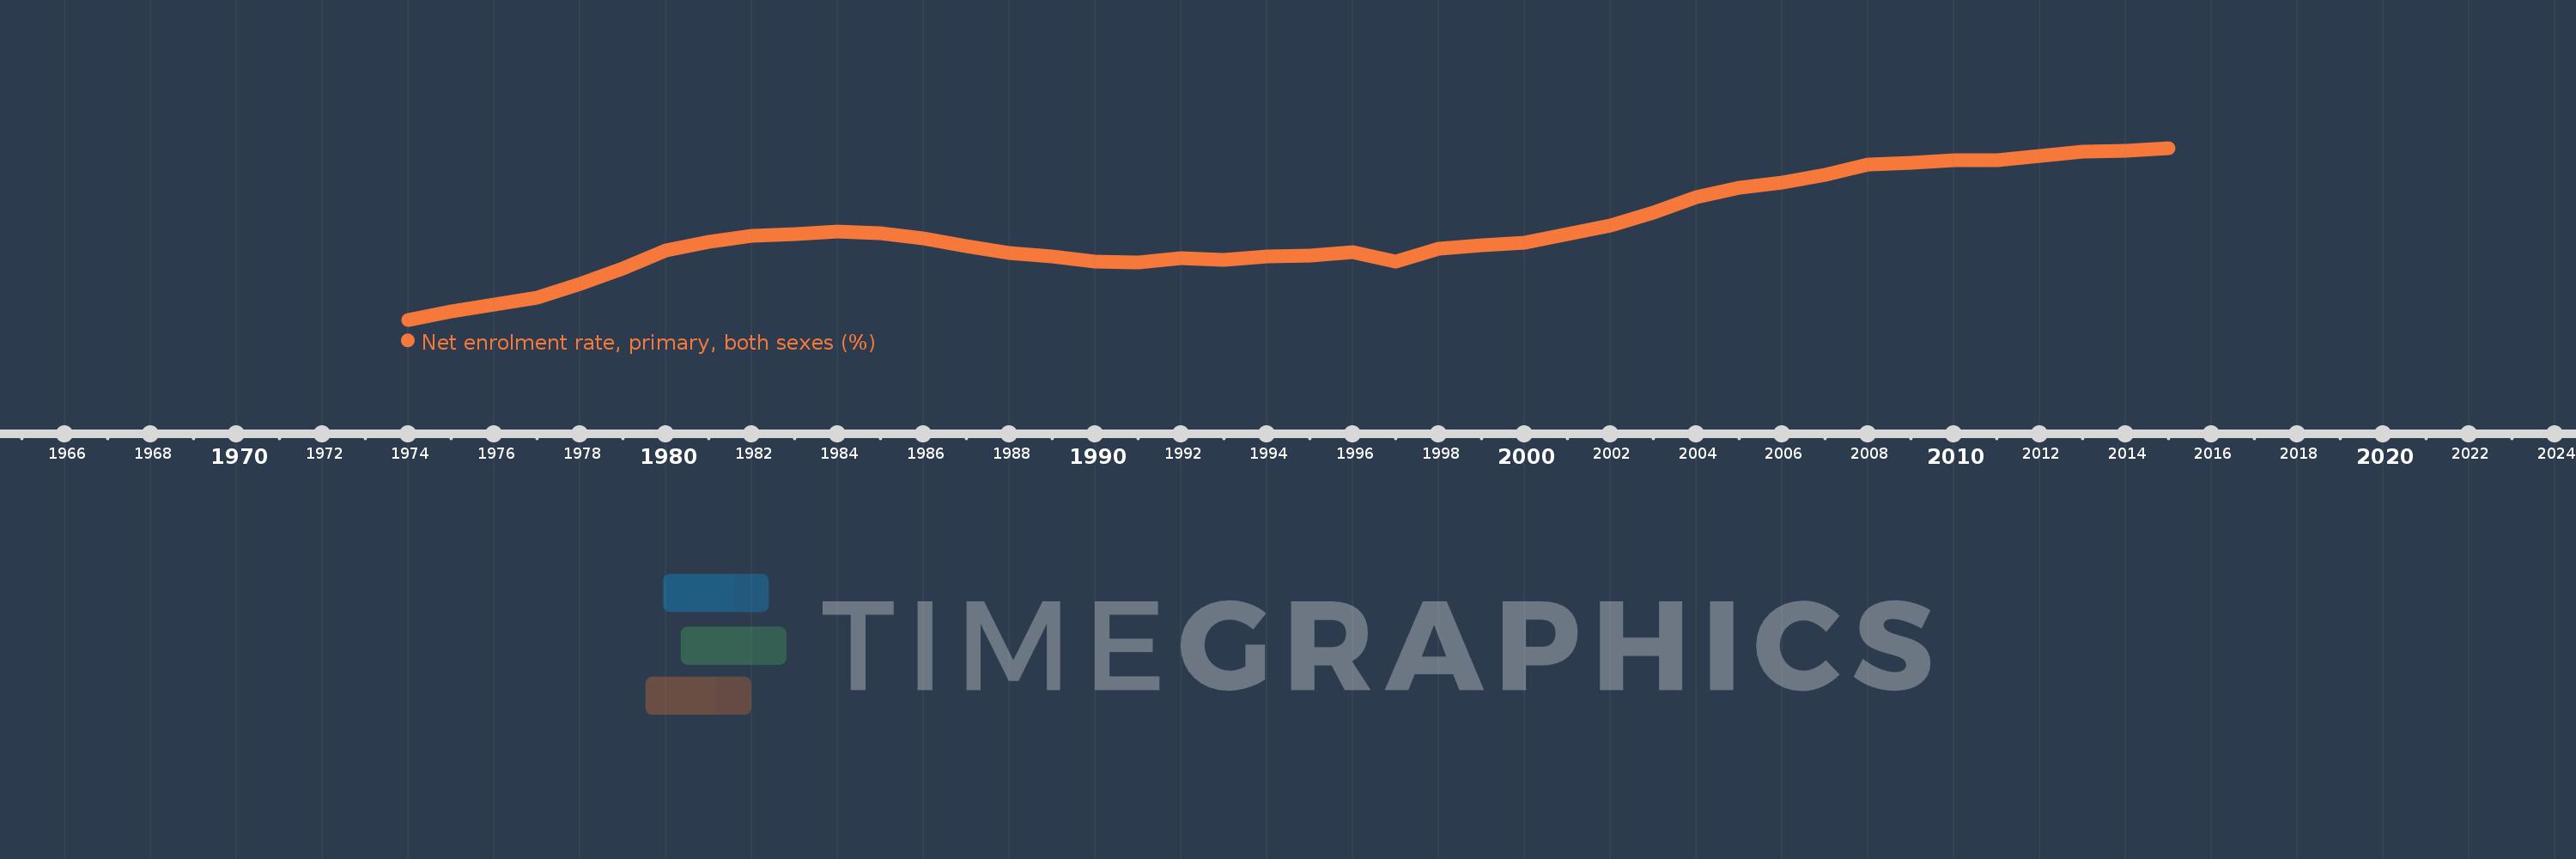
Net enrolment rate, primary, both sexes (%)
2015,2014,2013,2012,2011,2010,2009,2008,2007,2006,2005,2004,2003,2002,2001,2000,1999,1998,1997,1996,1995,1994,1993,1992,1991,1990,1989,1988,1987,1986,1985,1984,1983,1982,1981,1980,1979,1978,1977,1976,1975,1974
This statistics in other country:
AfghanistanAlbaniaAlgeriaAngolaAntigua and BarbudaArab WorldArgentinaArmeniaArubaAustraliaAustriaAzerbaijanBahamas, TheBahrainBangladeshBarbadosBelarusBelgiumBelizeBeninBermudaBhutanBoliviaBosnia and HerzegovinaBotswanaBrazilBrunei DarussalamBulgariaBurkina FasoBurundiCabo VerdeCambodiaCameroonCanadaCaribbean small statesCentral African RepublicCentral Europe and the BalticsChadChileChinaColombiaComorosCongo, Dem. Rep.Congo, Rep.Costa RicaCote d'IvoireCroatiaCubaCyprusDenmarkDjiboutiDominicaDominican RepublicEarly-demographic dividendEast Asia & PacificEast Asia & Pacific (excluding high income)East Asia & Pacific (IDA & IBRD countries)EcuadorEgypt, Arab Rep.El SalvadorEquatorial GuineaEritreaEstoniaEthiopiaEuro areaEurope & Central AsiaEurope & Central Asia (excluding high income)Europe & Central Asia (IDA & IBRD countries)European UnionFijiFinlandFragile and conflict affected situationsFranceGabonGambia, TheGeorgiaGermanyGhanaGreeceGrenadaGuatemalaGuineaGuinea-BissauGuyanaHaitiHeavily indebted poor countries (HIPC)High incomeHondurasHong Kong SAR, ChinaHungaryIBRD onlyIcelandIDA & IBRD totalIDA blendIDA onlyIDA totalIndiaIndonesiaIran, Islamic Rep.IraqIrelandIsraelItalyJamaicaJapanJordanKazakhstanKenyaKiribatiKorea, Dem. People’s Rep.Korea, Rep.KuwaitKyrgyz RepublicLao PDRLate-demographic dividendLatin America & Caribbean Latin America & Caribbean (excluding high income)Latin America & the Caribbean (IDA & IBRD countries)LatviaLeast developed countries: UN classificationLebanonLesothoLiberiaLibyaLiechtensteinLithuaniaLow & middle incomeLow incomeLower middle incomeLuxembourgMacao SAR, ChinaMacedonia, FYRMadagascarMalawiMalaysiaMaldivesMaliMaltaMarshall IslandsMauritaniaMauritiusMexicoMicronesia, Fed. Sts.Middle East & North AfricaMiddle East & North Africa (excluding high income)Middle East & North Africa (IDA & IBRD countries)Middle incomeMoldovaMongoliaMontenegroMoroccoMozambiqueMyanmarNamibiaNauruNepalNetherlandsNew ZealandNicaraguaNigerNigeriaNorth AmericaNorwayOECD membersOmanOther small statesPacific island small statesPakistanPalauPanamaPapua New GuineaParaguayPeruPhilippinesPolandPortugalPost-demographic dividendPre-demographic dividendPuerto RicoQatarRomaniaRussian FederationRwandaSamoaSan MarinoSao Tome and PrincipeSaudi ArabiaSenegalSerbiaSeychellesSierra LeoneSloveniaSmall statesSolomon IslandsSomaliaSouth AfricaSouth AsiaSouth Asia (IDA & IBRD)South SudanSpainSri LankaSt. Kitts and NevisSt. LuciaSt. Vincent and the GrenadinesSub-Saharan Africa Sub-Saharan Africa (excluding high income)Sub-Saharan Africa (IDA & IBRD countries)SudanSurinameSwazilandSwedenSwitzerlandSyrian Arab RepublicTajikistanTanzaniaThailandTimor-LesteTogoTongaTrinidad and TobagoTunisiaTurkeyTuvaluUgandaUkraineUnited Arab EmiratesUnited KingdomUnited StatesUpper middle incomeUruguayUzbekistanVanuatuVenezuela, RBVietnamWest Bank and GazaWorldYemen, Rep.ZambiaZimbabwe Timeline:
This timeline shows a graph from 1974 to 2015 of Pre-demographic dividend. No data until 1973. Number of actual observations by date: 42.
Source name:
World Development Indicators
Source organization:
UNESCO Institute for Statistics
Categories, topics:
Education
Last updated:
apr 23, 2017
Indicators value changes by year
Minimum:
39.546
jan 1, 1974
Maximum:
75.881
jan 1, 2015
At the date of observation
Value
Absolute change
Change from previous value
jan 1, 1974
39.546
+39.546
0.0%
jan 1, 1975
41.387
+1.842
4.66%
jan 1, 1976
42.818
+1.431
3.46%
jan 1, 1977
44.301
+1.483
3.46%
jan 1, 1978
47.07
+2.768
6.25%
jan 1, 1979
50.446
+3.376
7.17%
jan 1, 1980
54.234
+3.788
7.51%
jan 1, 1981
55.936
+1.702
3.14%
jan 1, 1982
57.25
+1.314
2.35%
jan 1, 1983
57.643
+0.394
0.69%
jan 1, 1984
58.157
+0.514
0.89%
jan 1, 1985
57.846
-0.311
-0.53%
jan 1, 1986
56.676
-1.17
-2.02%
jan 1, 1987
55.035
-1.641
-2.9%
jan 1, 1988
53.72
-1.316
-2.39%
jan 1, 1989
53.02
-0.7
-1.3%
jan 1, 1990
51.887
-1.133
-2.14%
jan 1, 1991
51.716
-0.171
-0.33%
jan 1, 1992
52.661
+0.945
1.83%
jan 1, 1993
52.157
-0.504
-0.96%
jan 1, 1994
52.862
+0.704
1.35%
jan 1, 1995
53.122
+0.261
0.49%
jan 1, 1996
53.815
+0.693
1.3%
jan 1, 1997
51.76
-2.056
-3.82%
jan 1, 1998
54.502
+2.742
5.3%
jan 1, 1999
55.318
+0.816
1.5%
jan 1, 2000
55.855
+0.537
0.97%
jan 1, 2001
57.654
+1.799
3.22%
jan 1, 2002
59.469
+1.815
3.15%
jan 1, 2003
62.122
+2.653
4.46%
jan 1, 2004
65.51
+3.389
5.45%
jan 1, 2005
67.544
+2.034
3.1%
jan 1, 2006
68.61
+1.066
1.58%
jan 1, 2007
70.182
+1.572
2.29%
jan 1, 2008
72.376
+2.194
3.13%
jan 1, 2009
72.817
+0.44
0.61%
jan 1, 2010
73.194
+0.377
0.52%
jan 1, 2011
73.346
+0.153
0.21%
jan 1, 2012
74.189
+0.843
1.15%
jan 1, 2013
75.158
+0.969
1.31%
jan 1, 2014
75.344
+0.186
0.25%
jan 1, 2015
75.881
+0.537
0.71%
Ranking of countries by current statistics by years


Comments: