29
/
en
AIzaSyAYiBZKx7MnpbEhh9jyipgxe19OcubqV5w
April 1, 2024
52878
OECD members
OED
false
2
1
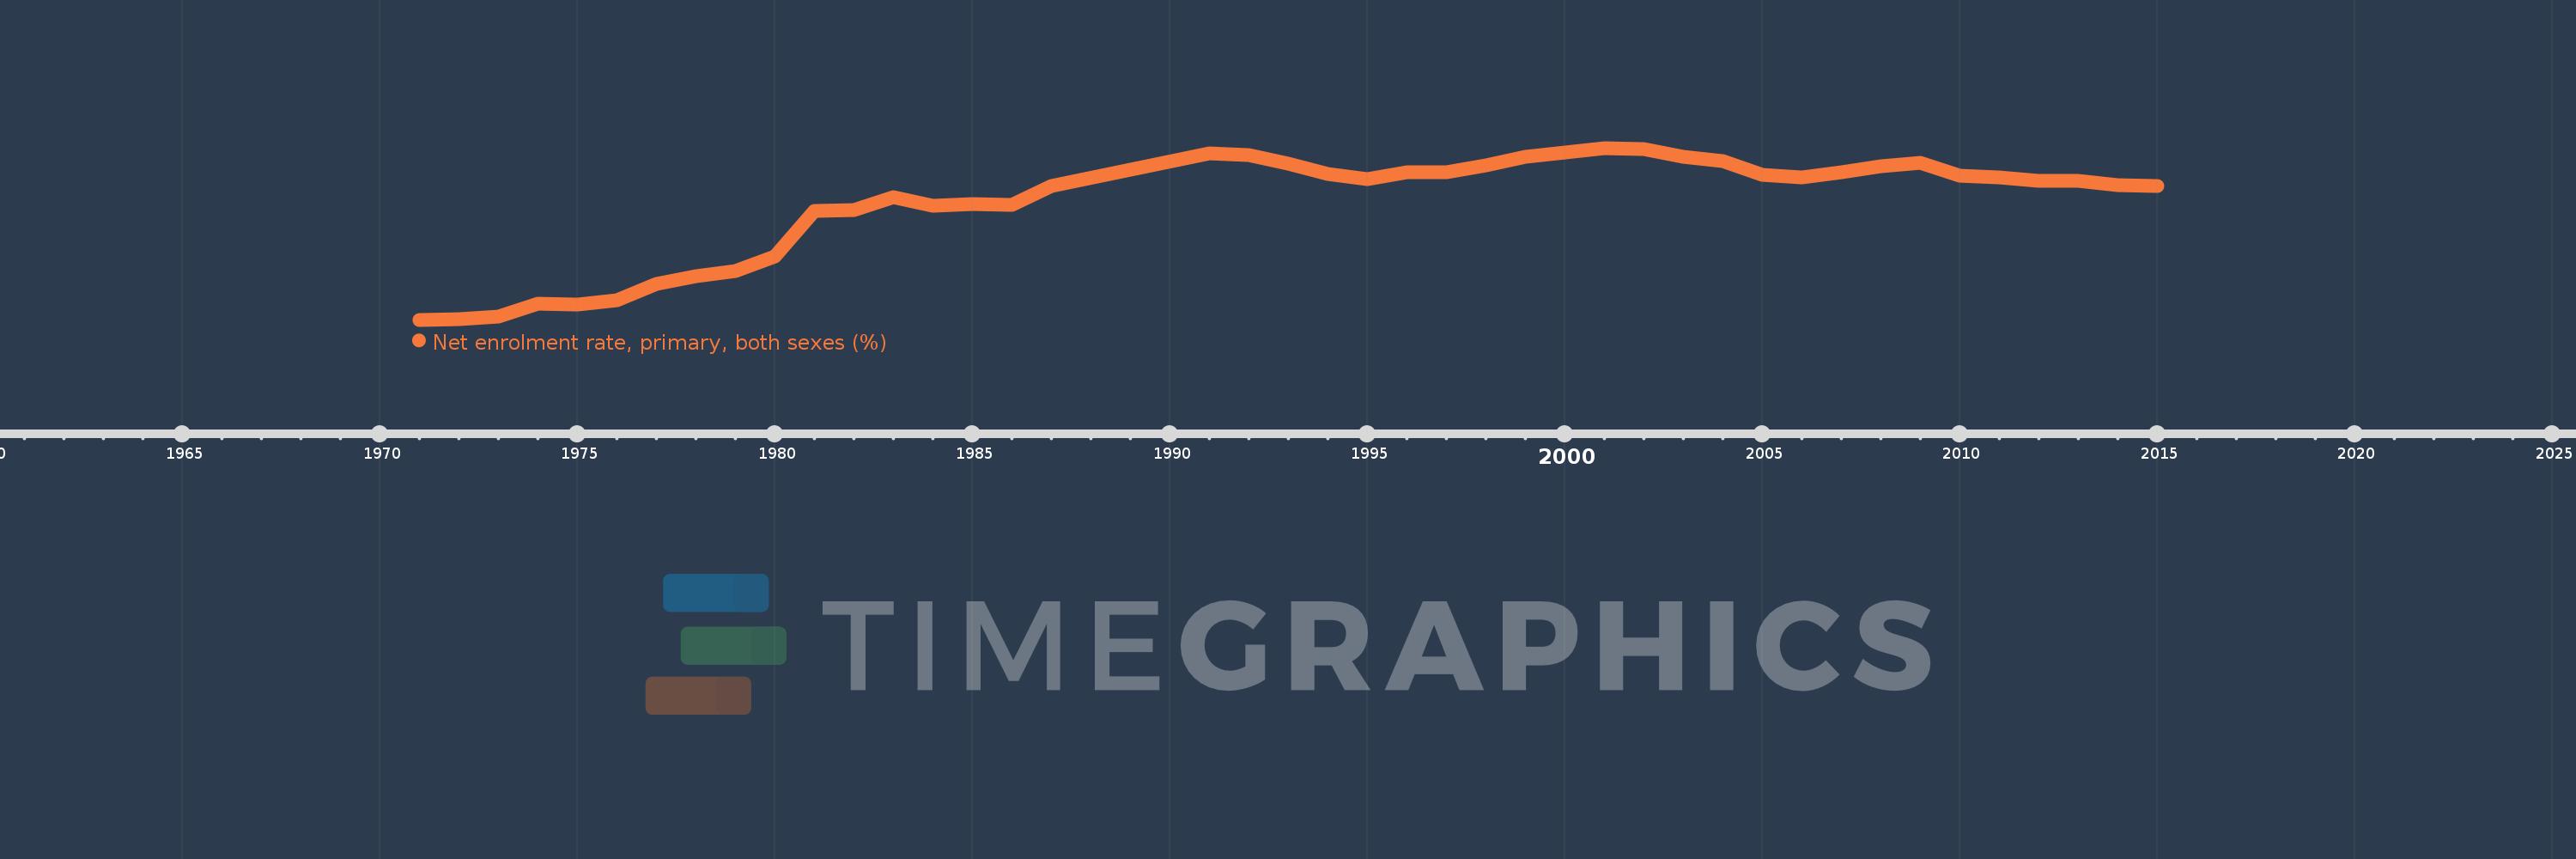
Net enrolment rate, primary, both sexes (%)
2015,2014,2013,2012,2011,2010,2009,2008,2007,2006,2005,2004,2003,2002,2001,2000,1999,1998,1997,1996,1995,1994,1993,1992,1991,1987,1986,1985,1984,1983,1982,1981,1980,1979,1978,1977,1976,1975,1974,1973,1972,1971
This statistics in other country:
AfghanistanAlbaniaAlgeriaAngolaAntigua and BarbudaArab WorldArgentinaArmeniaArubaAustraliaAustriaAzerbaijanBahamas, TheBahrainBangladeshBarbadosBelarusBelgiumBelizeBeninBermudaBhutanBoliviaBosnia and HerzegovinaBotswanaBrazilBrunei DarussalamBulgariaBurkina FasoBurundiCabo VerdeCambodiaCameroonCanadaCaribbean small statesCentral African RepublicCentral Europe and the BalticsChadChileChinaColombiaComorosCongo, Dem. Rep.Congo, Rep.Costa RicaCote d'IvoireCroatiaCubaCyprusDenmarkDjiboutiDominicaDominican RepublicEarly-demographic dividendEast Asia & PacificEast Asia & Pacific (excluding high income)East Asia & Pacific (IDA & IBRD countries)EcuadorEgypt, Arab Rep.El SalvadorEquatorial GuineaEritreaEstoniaEthiopiaEuro areaEurope & Central AsiaEurope & Central Asia (excluding high income)Europe & Central Asia (IDA & IBRD countries)European UnionFijiFinlandFragile and conflict affected situationsFranceGabonGambia, TheGeorgiaGermanyGhanaGreeceGrenadaGuatemalaGuineaGuinea-BissauGuyanaHaitiHeavily indebted poor countries (HIPC)High incomeHondurasHong Kong SAR, ChinaHungaryIBRD onlyIcelandIDA & IBRD totalIDA blendIDA onlyIDA totalIndiaIndonesiaIran, Islamic Rep.IraqIrelandIsraelItalyJamaicaJapanJordanKazakhstanKenyaKiribatiKorea, Dem. People’s Rep.Korea, Rep.KuwaitKyrgyz RepublicLao PDRLate-demographic dividendLatin America & Caribbean Latin America & Caribbean (excluding high income)Latin America & the Caribbean (IDA & IBRD countries)LatviaLeast developed countries: UN classificationLebanonLesothoLiberiaLibyaLiechtensteinLithuaniaLow & middle incomeLow incomeLower middle incomeLuxembourgMacao SAR, ChinaMacedonia, FYRMadagascarMalawiMalaysiaMaldivesMaliMaltaMarshall IslandsMauritaniaMauritiusMexicoMicronesia, Fed. Sts.Middle East & North AfricaMiddle East & North Africa (excluding high income)Middle East & North Africa (IDA & IBRD countries)Middle incomeMoldovaMongoliaMontenegroMoroccoMozambiqueMyanmarNamibiaNauruNepalNetherlandsNew ZealandNicaraguaNigerNigeriaNorth AmericaNorwayOECD membersOmanOther small statesPacific island small statesPakistanPalauPanamaPapua New GuineaParaguayPeruPhilippinesPolandPortugalPost-demographic dividendPre-demographic dividendPuerto RicoQatarRomaniaRussian FederationRwandaSamoaSan MarinoSao Tome and PrincipeSaudi ArabiaSenegalSerbiaSeychellesSierra LeoneSloveniaSmall statesSolomon IslandsSomaliaSouth AfricaSouth AsiaSouth Asia (IDA & IBRD)South SudanSpainSri LankaSt. Kitts and NevisSt. LuciaSt. Vincent and the GrenadinesSub-Saharan Africa Sub-Saharan Africa (excluding high income)Sub-Saharan Africa (IDA & IBRD countries)SudanSurinameSwazilandSwedenSwitzerlandSyrian Arab RepublicTajikistanTanzaniaThailandTimor-LesteTogoTongaTrinidad and TobagoTunisiaTurkeyTuvaluUgandaUkraineUnited Arab EmiratesUnited KingdomUnited StatesUpper middle incomeUruguayUzbekistanVanuatuVenezuela, RBVietnamWest Bank and GazaWorldYemen, Rep.ZambiaZimbabwe Timeline:
This timeline shows a graph from 1971 to 2015 of OECD members. No data until 1970. Number of actual observations by date: 42.
Source name:
World Development Indicators
Source organization:
UNESCO Institute for Statistics
Categories, topics:
Education
Last updated:
apr 23, 2017
Indicators value changes by year
Minimum:
90.105
jan 1, 1971
Maximum:
97.497
jan 1, 2001
At the date of observation
Value
Absolute change
Change from previous value
jan 1, 1971
90.105
+90.105
0.0%
jan 1, 1972
90.126
+0.022
0.02%
jan 1, 1973
90.231
+0.105
0.12%
jan 1, 1974
90.803
+0.572
0.63%
jan 1, 1975
90.749
-0.054
-0.06%
jan 1, 1976
90.953
+0.204
0.22%
jan 1, 1977
91.634
+0.681
0.75%
jan 1, 1978
91.992
+0.357
0.39%
jan 1, 1979
92.212
+0.22
0.24%
jan 1, 1980
92.823
+0.611
0.66%
jan 1, 1981
94.789
+1.967
2.12%
jan 1, 1982
94.836
+0.046
0.05%
jan 1, 1983
95.372
+0.537
0.57%
jan 1, 1984
94.995
-0.377
-0.4%
jan 1, 1985
95.098
+0.103
0.11%
jan 1, 1986
95.035
-0.063
-0.07%
jan 1, 1987
95.847
+0.811
0.85%
jan 1, 1991
97.273
+1.426
1.49%
jan 1, 1992
97.199
-0.074
-0.08%
jan 1, 1993
96.819
-0.379
-0.39%
jan 1, 1994
96.378
-0.441
-0.46%
jan 1, 1995
96.165
-0.213
-0.22%
jan 1, 1996
96.439
+0.274
0.28%
jan 1, 1997
96.434
-0.005
-0.01%
jan 1, 1998
96.751
+0.317
0.33%
jan 1, 1999
97.1
+0.349
0.36%
jan 1, 2000
97.315
+0.215
0.22%
jan 1, 2001
97.497
+0.182
0.19%
jan 1, 2002
97.452
-0.045
-0.05%
jan 1, 2003
97.118
-0.334
-0.34%
jan 1, 2004
96.939
-0.179
-0.18%
jan 1, 2005
96.328
-0.611
-0.63%
jan 1, 2006
96.232
-0.097
-0.1%
jan 1, 2007
96.452
+0.221
0.23%
jan 1, 2008
96.709
+0.257
0.27%
jan 1, 2009
96.861
+0.152
0.16%
jan 1, 2010
96.32
-0.541
-0.56%
jan 1, 2011
96.219
-0.102
-0.11%
jan 1, 2012
96.085
-0.133
-0.14%
jan 1, 2013
96.081
-0.005
0.0%
jan 1, 2014
95.887
-0.194
-0.2%
jan 1, 2015
95.868
-0.019
-0.02%
Ranking of countries by current statistics by years


Comments: