29
/
en
AIzaSyAYiBZKx7MnpbEhh9jyipgxe19OcubqV5w
April 1, 2024
34451
Fragile and conflict affected situations
FCS
false
2
1
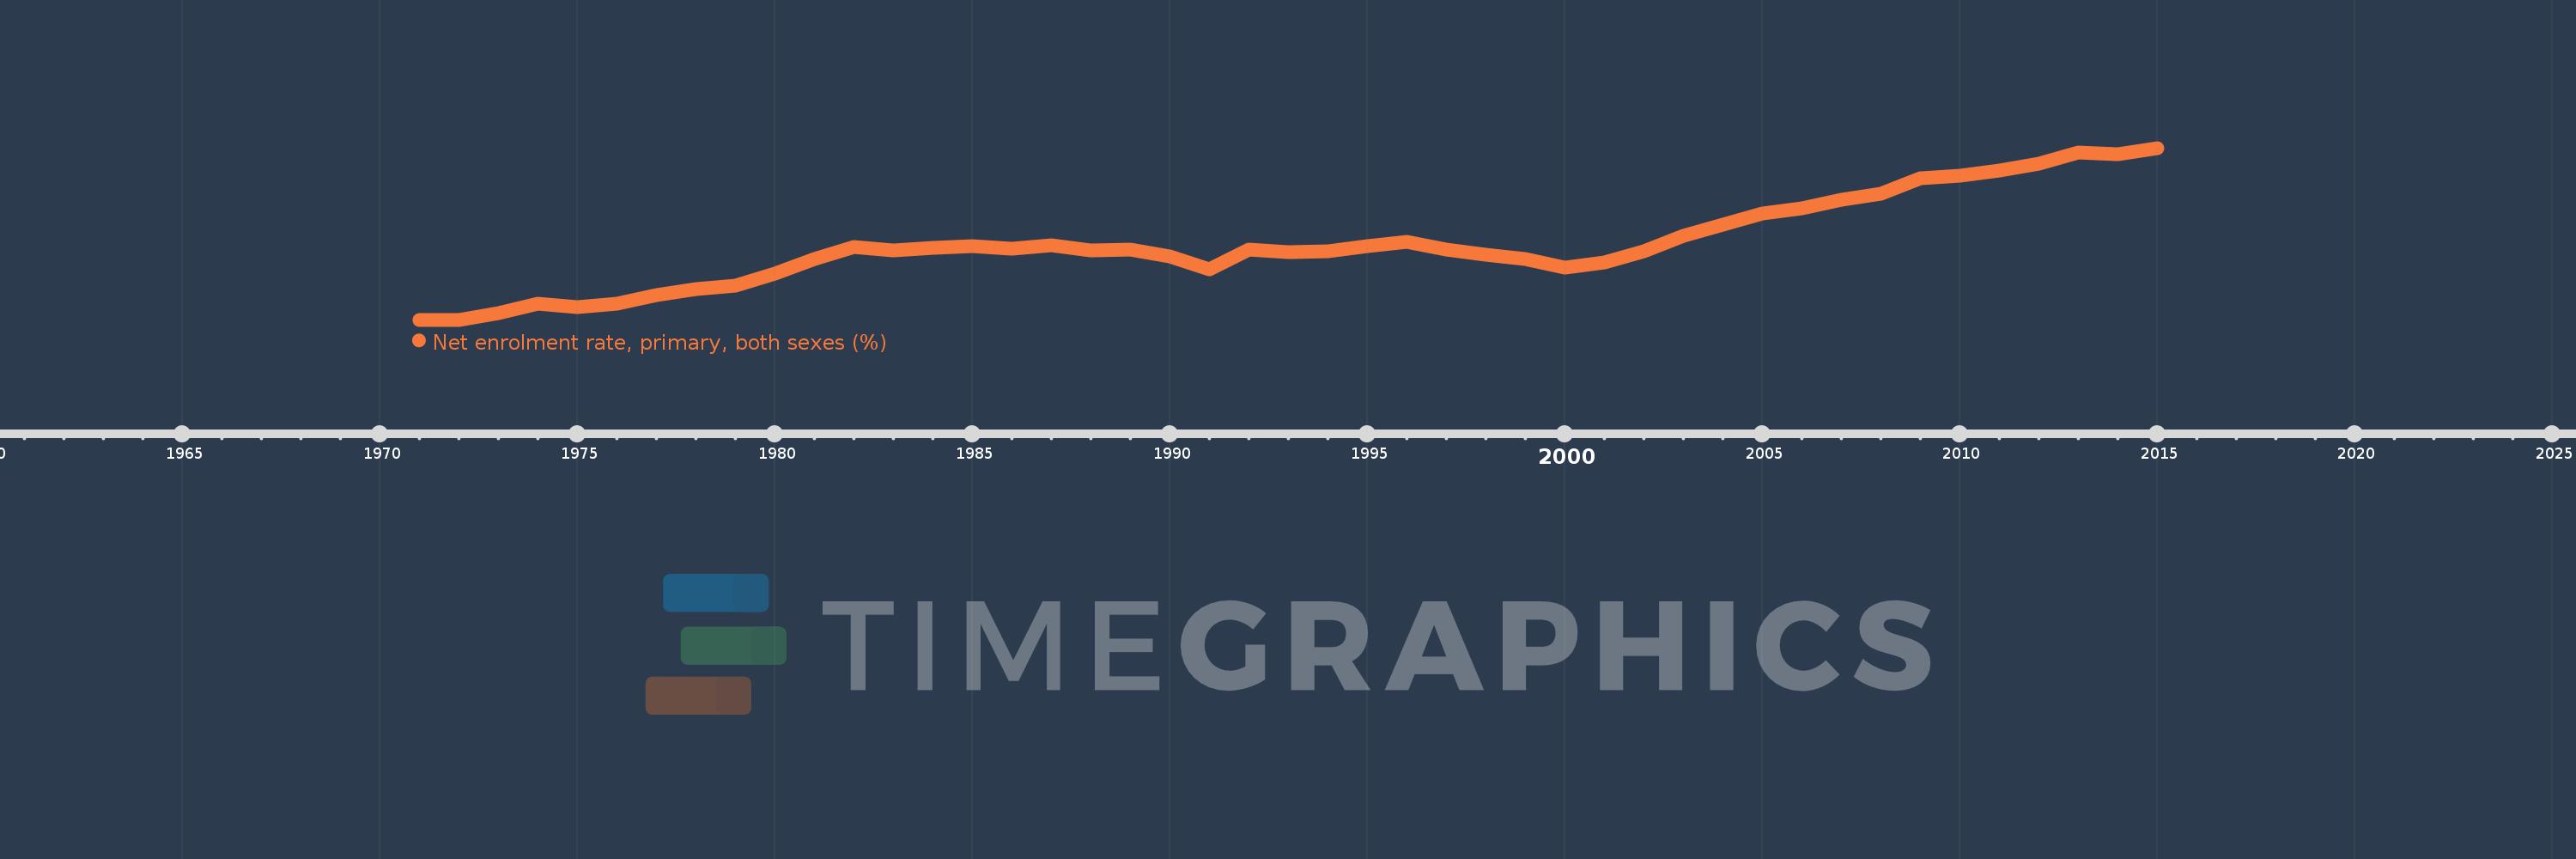
Net enrolment rate, primary, both sexes (%)
2015,2014,2013,2012,2011,2010,2009,2008,2007,2006,2005,2004,2003,2002,2001,2000,1999,1998,1997,1996,1995,1994,1993,1992,1991,1990,1989,1988,1987,1986,1985,1984,1983,1982,1981,1980,1979,1978,1977,1976,1975,1974,1973,1972,1971
This statistics in other country:
AfghanistanAlbaniaAlgeriaAngolaAntigua and BarbudaArab WorldArgentinaArmeniaArubaAustraliaAustriaAzerbaijanBahamas, TheBahrainBangladeshBarbadosBelarusBelgiumBelizeBeninBermudaBhutanBoliviaBosnia and HerzegovinaBotswanaBrazilBrunei DarussalamBulgariaBurkina FasoBurundiCabo VerdeCambodiaCameroonCanadaCaribbean small statesCentral African RepublicCentral Europe and the BalticsChadChileChinaColombiaComorosCongo, Dem. Rep.Congo, Rep.Costa RicaCote d'IvoireCroatiaCubaCyprusDenmarkDjiboutiDominicaDominican RepublicEarly-demographic dividendEast Asia & PacificEast Asia & Pacific (excluding high income)East Asia & Pacific (IDA & IBRD countries)EcuadorEgypt, Arab Rep.El SalvadorEquatorial GuineaEritreaEstoniaEthiopiaEuro areaEurope & Central AsiaEurope & Central Asia (excluding high income)Europe & Central Asia (IDA & IBRD countries)European UnionFijiFinlandFragile and conflict affected situationsFranceGabonGambia, TheGeorgiaGermanyGhanaGreeceGrenadaGuatemalaGuineaGuinea-BissauGuyanaHaitiHeavily indebted poor countries (HIPC)High incomeHondurasHong Kong SAR, ChinaHungaryIBRD onlyIcelandIDA & IBRD totalIDA blendIDA onlyIDA totalIndiaIndonesiaIran, Islamic Rep.IraqIrelandIsraelItalyJamaicaJapanJordanKazakhstanKenyaKiribatiKorea, Dem. People’s Rep.Korea, Rep.KuwaitKyrgyz RepublicLao PDRLate-demographic dividendLatin America & Caribbean Latin America & Caribbean (excluding high income)Latin America & the Caribbean (IDA & IBRD countries)LatviaLeast developed countries: UN classificationLebanonLesothoLiberiaLibyaLiechtensteinLithuaniaLow & middle incomeLow incomeLower middle incomeLuxembourgMacao SAR, ChinaMacedonia, FYRMadagascarMalawiMalaysiaMaldivesMaliMaltaMarshall IslandsMauritaniaMauritiusMexicoMicronesia, Fed. Sts.Middle East & North AfricaMiddle East & North Africa (excluding high income)Middle East & North Africa (IDA & IBRD countries)Middle incomeMoldovaMongoliaMontenegroMoroccoMozambiqueMyanmarNamibiaNauruNepalNetherlandsNew ZealandNicaraguaNigerNigeriaNorth AmericaNorwayOECD membersOmanOther small statesPacific island small statesPakistanPalauPanamaPapua New GuineaParaguayPeruPhilippinesPolandPortugalPost-demographic dividendPre-demographic dividendPuerto RicoQatarRomaniaRussian FederationRwandaSamoaSan MarinoSao Tome and PrincipeSaudi ArabiaSenegalSerbiaSeychellesSierra LeoneSloveniaSmall statesSolomon IslandsSomaliaSouth AfricaSouth AsiaSouth Asia (IDA & IBRD)South SudanSpainSri LankaSt. Kitts and NevisSt. LuciaSt. Vincent and the GrenadinesSub-Saharan Africa Sub-Saharan Africa (excluding high income)Sub-Saharan Africa (IDA & IBRD countries)SudanSurinameSwazilandSwedenSwitzerlandSyrian Arab RepublicTajikistanTanzaniaThailandTimor-LesteTogoTongaTrinidad and TobagoTunisiaTurkeyTuvaluUgandaUkraineUnited Arab EmiratesUnited KingdomUnited StatesUpper middle incomeUruguayUzbekistanVanuatuVenezuela, RBVietnamWest Bank and GazaWorldYemen, Rep.ZambiaZimbabwe Timeline:
This timeline shows a graph from 1971 to 2015 of Fragile and conflict affected situations. No data until 1970. Number of actual observations by date: 45.
Source name:
World Development Indicators
Source organization:
UNESCO Institute for Statistics
Categories, topics:
Education
Last updated:
apr 23, 2017
Indicators value changes by year
Minimum:
49.227
jan 1, 1972
Maximum:
75.809
jan 1, 2015
At the date of observation
Value
Absolute change
Change from previous value
jan 1, 1971
49.227
+49.227
0.0%
jan 1, 1972
49.227
0.0
0.0%
jan 1, 1973
50.255
+1.028
2.09%
jan 1, 1974
51.762
+1.508
3.0%
jan 1, 1975
51.121
-0.641
-1.24%
jan 1, 1976
51.724
+0.603
1.18%
jan 1, 1977
53.017
+1.293
2.5%
jan 1, 1978
53.964
+0.947
1.79%
jan 1, 1979
54.561
+0.597
1.11%
jan 1, 1980
56.392
+1.831
3.36%
jan 1, 1981
58.622
+2.23
3.95%
jan 1, 1982
60.472
+1.851
3.16%
jan 1, 1983
59.914
-0.558
-0.92%
jan 1, 1984
60.386
+0.472
0.79%
jan 1, 1985
60.587
+0.2
0.33%
jan 1, 1986
60.244
-0.343
-0.57%
jan 1, 1987
60.706
+0.462
0.77%
jan 1, 1988
59.987
-0.719
-1.18%
jan 1, 1989
60.051
+0.064
0.11%
jan 1, 1990
58.985
-1.066
-1.77%
jan 1, 1991
56.979
-2.006
-3.4%
jan 1, 1992
60.143
+3.163
5.55%
jan 1, 1993
59.678
-0.465
-0.77%
jan 1, 1994
59.838
+0.16
0.27%
jan 1, 1995
60.595
+0.757
1.27%
jan 1, 1996
61.295
+0.701
1.16%
jan 1, 1997
60.129
-1.166
-1.9%
jan 1, 1998
59.289
-0.84
-1.4%
jan 1, 1999
58.588
-0.701
-1.18%
jan 1, 2000
57.302
-1.286
-2.19%
jan 1, 2001
58.122
+0.819
1.43%
jan 1, 2002
59.817
+1.696
2.92%
jan 1, 2003
62.164
+2.347
3.92%
jan 1, 2004
63.989
+1.825
2.94%
jan 1, 2005
65.653
+1.664
2.6%
jan 1, 2006
66.443
+0.789
1.2%
jan 1, 2007
67.817
+1.374
2.07%
jan 1, 2008
68.67
+0.853
1.26%
jan 1, 2009
71.159
+2.489
3.62%
jan 1, 2010
71.579
+0.421
0.59%
jan 1, 2011
72.351
+0.772
1.08%
jan 1, 2012
73.314
+0.963
1.33%
jan 1, 2013
75.122
+1.808
2.47%
jan 1, 2014
74.786
-0.336
-0.45%
jan 1, 2015
75.809
+1.023
1.37%
Ranking of countries by current statistics by years


Comments: