29
/
en
AIzaSyAYiBZKx7MnpbEhh9jyipgxe19OcubqV5w
April 1, 2024
53645
Other small states
OSS
false
2
1
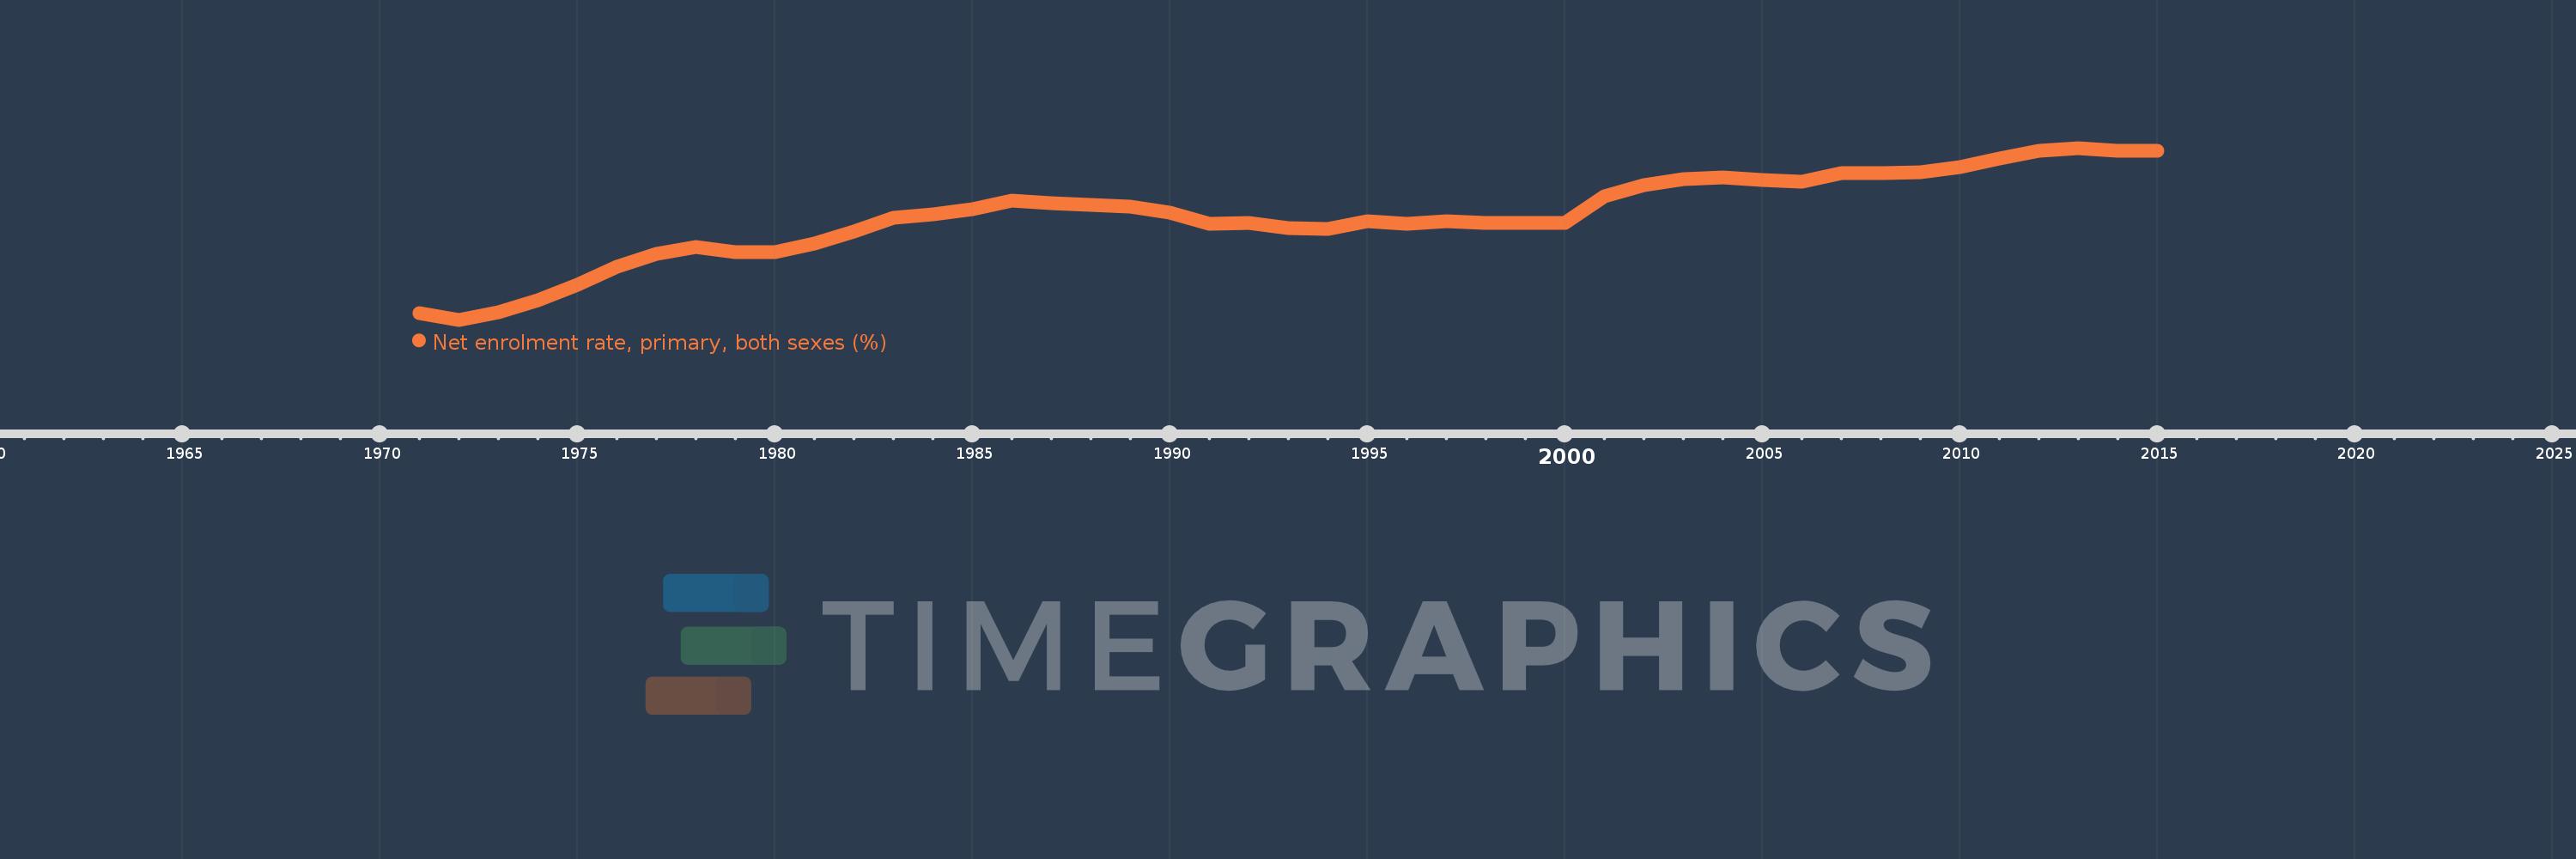
Net enrolment rate, primary, both sexes (%)
2015,2014,2013,2012,2011,2010,2009,2008,2007,2006,2005,2004,2003,2002,2001,2000,1999,1998,1997,1996,1995,1994,1993,1992,1991,1990,1989,1988,1987,1986,1985,1984,1983,1982,1981,1980,1979,1978,1977,1976,1975,1974,1973,1972,1971
This statistics in other country:
AfghanistanAlbaniaAlgeriaAngolaAntigua and BarbudaArab WorldArgentinaArmeniaArubaAustraliaAustriaAzerbaijanBahamas, TheBahrainBangladeshBarbadosBelarusBelgiumBelizeBeninBermudaBhutanBoliviaBosnia and HerzegovinaBotswanaBrazilBrunei DarussalamBulgariaBurkina FasoBurundiCabo VerdeCambodiaCameroonCanadaCaribbean small statesCentral African RepublicCentral Europe and the BalticsChadChileChinaColombiaComorosCongo, Dem. Rep.Congo, Rep.Costa RicaCote d'IvoireCroatiaCubaCyprusDenmarkDjiboutiDominicaDominican RepublicEarly-demographic dividendEast Asia & PacificEast Asia & Pacific (excluding high income)East Asia & Pacific (IDA & IBRD countries)EcuadorEgypt, Arab Rep.El SalvadorEquatorial GuineaEritreaEstoniaEthiopiaEuro areaEurope & Central AsiaEurope & Central Asia (excluding high income)Europe & Central Asia (IDA & IBRD countries)European UnionFijiFinlandFragile and conflict affected situationsFranceGabonGambia, TheGeorgiaGermanyGhanaGreeceGrenadaGuatemalaGuineaGuinea-BissauGuyanaHaitiHeavily indebted poor countries (HIPC)High incomeHondurasHong Kong SAR, ChinaHungaryIBRD onlyIcelandIDA & IBRD totalIDA blendIDA onlyIDA totalIndiaIndonesiaIran, Islamic Rep.IraqIrelandIsraelItalyJamaicaJapanJordanKazakhstanKenyaKiribatiKorea, Dem. People’s Rep.Korea, Rep.KuwaitKyrgyz RepublicLao PDRLate-demographic dividendLatin America & Caribbean Latin America & Caribbean (excluding high income)Latin America & the Caribbean (IDA & IBRD countries)LatviaLeast developed countries: UN classificationLebanonLesothoLiberiaLibyaLiechtensteinLithuaniaLow & middle incomeLow incomeLower middle incomeLuxembourgMacao SAR, ChinaMacedonia, FYRMadagascarMalawiMalaysiaMaldivesMaliMaltaMarshall IslandsMauritaniaMauritiusMexicoMicronesia, Fed. Sts.Middle East & North AfricaMiddle East & North Africa (excluding high income)Middle East & North Africa (IDA & IBRD countries)Middle incomeMoldovaMongoliaMontenegroMoroccoMozambiqueMyanmarNamibiaNauruNepalNetherlandsNew ZealandNicaraguaNigerNigeriaNorth AmericaNorwayOECD membersOmanOther small statesPacific island small statesPakistanPalauPanamaPapua New GuineaParaguayPeruPhilippinesPolandPortugalPost-demographic dividendPre-demographic dividendPuerto RicoQatarRomaniaRussian FederationRwandaSamoaSan MarinoSao Tome and PrincipeSaudi ArabiaSenegalSerbiaSeychellesSierra LeoneSloveniaSmall statesSolomon IslandsSomaliaSouth AfricaSouth AsiaSouth Asia (IDA & IBRD)South SudanSpainSri LankaSt. Kitts and NevisSt. LuciaSt. Vincent and the GrenadinesSub-Saharan Africa Sub-Saharan Africa (excluding high income)Sub-Saharan Africa (IDA & IBRD countries)SudanSurinameSwazilandSwedenSwitzerlandSyrian Arab RepublicTajikistanTanzaniaThailandTimor-LesteTogoTongaTrinidad and TobagoTunisiaTurkeyTuvaluUgandaUkraineUnited Arab EmiratesUnited KingdomUnited StatesUpper middle incomeUruguayUzbekistanVanuatuVenezuela, RBVietnamWest Bank and GazaWorldYemen, Rep.ZambiaZimbabwe Timeline:
This timeline shows a graph from 1971 to 2015 of Other small states. No data until 1970. Number of actual observations by date: 45.
Source name:
World Development Indicators
Source organization:
UNESCO Institute for Statistics
Categories, topics:
Education
Last updated:
apr 23, 2017
Indicators value changes by year
Minimum:
64.507
jan 1, 1972
At the date of observation
Value
Absolute change
Change from previous value
jan 1, 1971
65.301
+65.301
0.0%
jan 1, 1972
64.507
-0.794
-1.22%
jan 1, 1973
65.403
+0.895
1.39%
jan 1, 1974
66.694
+1.291
1.97%
jan 1, 1975
68.496
+1.803
2.7%
jan 1, 1976
70.589
+2.092
3.05%
jan 1, 1977
72.015
+1.426
2.02%
jan 1, 1978
72.838
+0.824
1.14%
jan 1, 1979
72.254
-0.585
-0.8%
jan 1, 1980
72.231
-0.023
-0.03%
jan 1, 1981
73.168
+0.937
1.3%
jan 1, 1982
74.53
+1.362
1.86%
jan 1, 1983
76.101
+1.572
2.11%
jan 1, 1984
76.524
+0.423
0.56%
jan 1, 1985
77.13
+0.606
0.79%
jan 1, 1986
78.106
+0.976
1.27%
jan 1, 1987
77.742
-0.363
-0.47%
jan 1, 1988
77.638
-0.104
-0.13%
jan 1, 1989
77.371
-0.267
-0.34%
jan 1, 1990
76.71
-0.661
-0.85%
jan 1, 1991
75.394
-1.316
-1.72%
jan 1, 1992
75.546
+0.152
0.2%
jan 1, 1993
74.917
-0.629
-0.83%
jan 1, 1994
74.855
-0.062
-0.08%
jan 1, 1995
75.776
+0.921
1.23%
jan 1, 1996
75.415
-0.361
-0.48%
jan 1, 1997
75.698
+0.283
0.38%
jan 1, 1998
75.555
-0.143
-0.19%
jan 1, 1999
75.56
+0.005
0.01%
jan 1, 2000
75.56
+0.0
0.0%
jan 1, 2001
78.586
+3.026
4.0%
jan 1, 2002
79.798
+1.212
1.54%
jan 1, 2003
80.507
+0.709
0.89%
jan 1, 2004
80.712
+0.205
0.25%
jan 1, 2005
80.438
-0.274
-0.34%
jan 1, 2006
80.259
-0.179
-0.22%
jan 1, 2007
81.204
+0.945
1.18%
jan 1, 2008
81.194
-0.01
-0.01%
jan 1, 2009
81.268
+0.074
0.09%
jan 1, 2010
81.869
+0.602
0.74%
jan 1, 2011
82.885
+1.016
1.24%
jan 1, 2012
83.746
+0.861
1.04%
jan 1, 2013
84.08
+0.333
0.4%
jan 1, 2014
83.769
-0.311
-0.37%
jan 1, 2015
83.753
-0.016
-0.02%
Ranking of countries by current statistics by years


Comments: