29
/
en
AIzaSyAYiBZKx7MnpbEhh9jyipgxe19OcubqV5w
April 1, 2024
107627
Colombia
COL
true
2
1
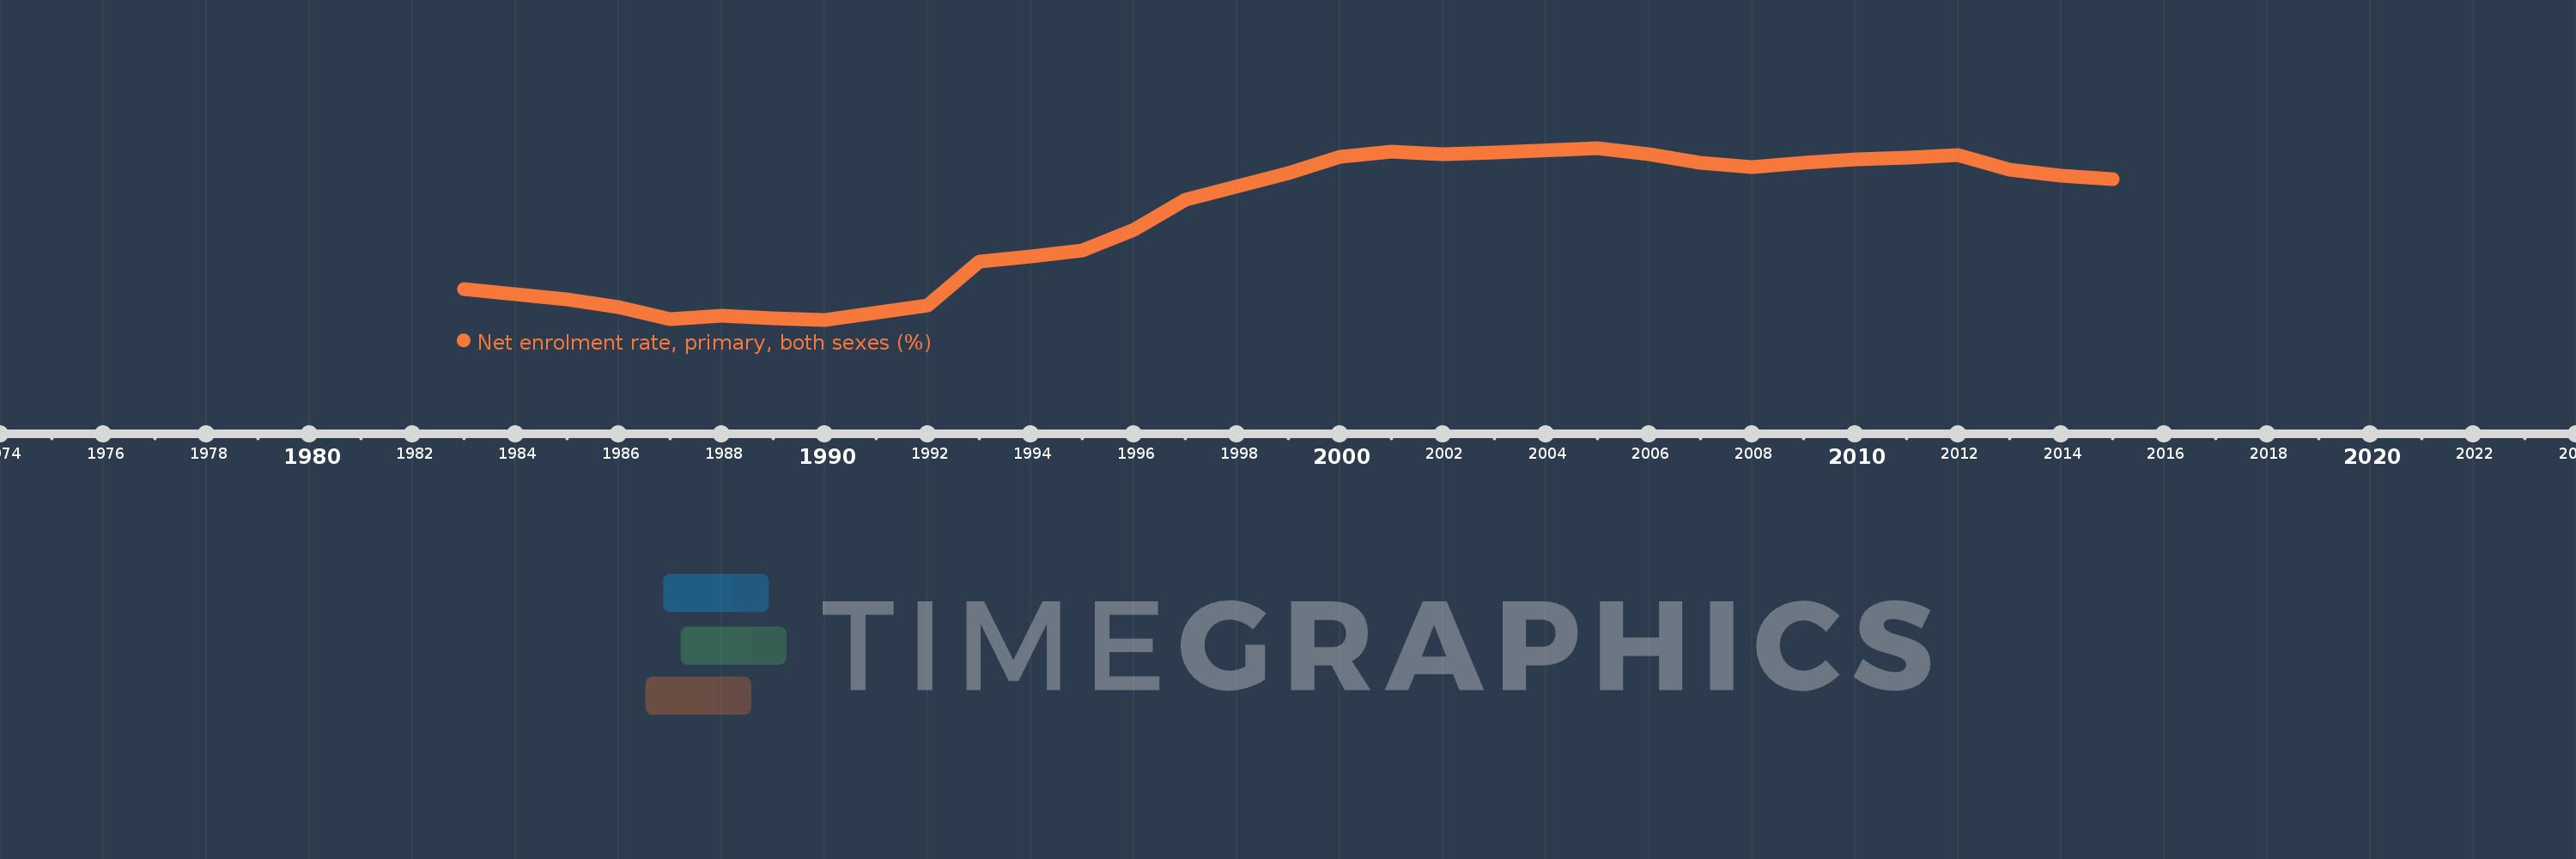
Net enrolment rate, primary, both sexes (%)
2015,2014,2013,2012,2011,2010,2009,2008,2007,2006,2005,2003,2002,2001,2000,1999,1997,1996,1995,1994,1993,1992,1990,1989,1988,1987,1986,1985,1983
This statistics in other country:
AfghanistanAlbaniaAlgeriaAngolaAntigua and BarbudaArab WorldArgentinaArmeniaArubaAustraliaAustriaAzerbaijanBahamas, TheBahrainBangladeshBarbadosBelarusBelgiumBelizeBeninBermudaBhutanBoliviaBosnia and HerzegovinaBotswanaBrazilBrunei DarussalamBulgariaBurkina FasoBurundiCabo VerdeCambodiaCameroonCanadaCaribbean small statesCentral African RepublicCentral Europe and the BalticsChadChileChinaColombiaComorosCongo, Dem. Rep.Congo, Rep.Costa RicaCote d'IvoireCroatiaCubaCyprusDenmarkDjiboutiDominicaDominican RepublicEarly-demographic dividendEast Asia & PacificEast Asia & Pacific (excluding high income)East Asia & Pacific (IDA & IBRD countries)EcuadorEgypt, Arab Rep.El SalvadorEquatorial GuineaEritreaEstoniaEthiopiaEuro areaEurope & Central AsiaEurope & Central Asia (excluding high income)Europe & Central Asia (IDA & IBRD countries)European UnionFijiFinlandFragile and conflict affected situationsFranceGabonGambia, TheGeorgiaGermanyGhanaGreeceGrenadaGuatemalaGuineaGuinea-BissauGuyanaHaitiHeavily indebted poor countries (HIPC)High incomeHondurasHong Kong SAR, ChinaHungaryIBRD onlyIcelandIDA & IBRD totalIDA blendIDA onlyIDA totalIndiaIndonesiaIran, Islamic Rep.IraqIrelandIsraelItalyJamaicaJapanJordanKazakhstanKenyaKiribatiKorea, Dem. People’s Rep.Korea, Rep.KuwaitKyrgyz RepublicLao PDRLate-demographic dividendLatin America & Caribbean Latin America & Caribbean (excluding high income)Latin America & the Caribbean (IDA & IBRD countries)LatviaLeast developed countries: UN classificationLebanonLesothoLiberiaLibyaLiechtensteinLithuaniaLow & middle incomeLow incomeLower middle incomeLuxembourgMacao SAR, ChinaMacedonia, FYRMadagascarMalawiMalaysiaMaldivesMaliMaltaMarshall IslandsMauritaniaMauritiusMexicoMicronesia, Fed. Sts.Middle East & North AfricaMiddle East & North Africa (excluding high income)Middle East & North Africa (IDA & IBRD countries)Middle incomeMoldovaMongoliaMontenegroMoroccoMozambiqueMyanmarNamibiaNauruNepalNetherlandsNew ZealandNicaraguaNigerNigeriaNorth AmericaNorwayOECD membersOmanOther small statesPacific island small statesPakistanPalauPanamaPapua New GuineaParaguayPeruPhilippinesPolandPortugalPost-demographic dividendPre-demographic dividendPuerto RicoQatarRomaniaRussian FederationRwandaSamoaSan MarinoSao Tome and PrincipeSaudi ArabiaSenegalSerbiaSeychellesSierra LeoneSloveniaSmall statesSolomon IslandsSomaliaSouth AfricaSouth AsiaSouth Asia (IDA & IBRD)South SudanSpainSri LankaSt. Kitts and NevisSt. LuciaSt. Vincent and the GrenadinesSub-Saharan Africa Sub-Saharan Africa (excluding high income)Sub-Saharan Africa (IDA & IBRD countries)SudanSurinameSwazilandSwedenSwitzerlandSyrian Arab RepublicTajikistanTanzaniaThailandTimor-LesteTogoTongaTrinidad and TobagoTunisiaTurkeyTuvaluUgandaUkraineUnited Arab EmiratesUnited KingdomUnited StatesUpper middle incomeUruguayUzbekistanVanuatuVenezuela, RBVietnamWest Bank and GazaWorldYemen, Rep.ZambiaZimbabwe Timeline:
This timeline shows a graph from 1983 to 2015 of Colombia. No data until 1982. Number of actual observations by date: 29.
Source name:
World Development Indicators
Source organization:
UNESCO Institute for Statistics
Categories, topics:
Education
Last updated:
apr 23, 2017
Indicators value changes by year
Minimum:
65.415
jan 1, 1990
Maximum:
95.308
jan 1, 2005
At the date of observation
Value
Absolute change
Change from previous value
jan 1, 1983
70.717
+70.717
0.0%
jan 1, 1985
69.002
-1.715
-2.42%
jan 1, 1986
67.648
-1.354
-1.96%
jan 1, 1987
65.558
-2.089
-3.09%
jan 1, 1988
66.055
+0.496
0.76%
jan 1, 1989
65.637
-0.417
-0.63%
jan 1, 1990
65.415
-0.223
-0.34%
jan 1, 1992
67.927
+2.512
3.84%
jan 1, 1993
75.547
+7.619
11.22%
jan 1, 1994
76.411
+0.864
1.14%
jan 1, 1995
77.521
+1.11
1.45%
jan 1, 1996
81.035
+3.515
4.53%
jan 1, 1997
86.276
+5.241
6.47%
jan 1, 1999
90.931
+4.655
5.39%
jan 1, 2000
93.732
+2.801
3.08%
jan 1, 2001
94.643
+0.911
0.97%
jan 1, 2002
94.192
-0.451
-0.48%
jan 1, 2003
94.466
+0.273
0.29%
jan 1, 2005
95.308
+0.843
0.89%
jan 1, 2006
94.208
-1.1
-1.15%
jan 1, 2007
92.755
-1.453
-1.54%
jan 1, 2008
91.964
-0.791
-0.85%
jan 1, 2009
92.667
+0.703
0.76%
jan 1, 2010
93.289
+0.622
0.67%
jan 1, 2011
93.568
+0.279
0.3%
jan 1, 2012
94.034
+0.466
0.5%
jan 1, 2013
91.472
-2.562
-2.72%
jan 1, 2014
90.476
-0.996
-1.09%
jan 1, 2015
89.833
-0.643
-0.71%
Ranking of countries by current statistics by years


Comments: