29
/
en
AIzaSyAYiBZKx7MnpbEhh9jyipgxe19OcubqV5w
April 1, 2024
170270
Korea, Rep.
KOR
true
2
1
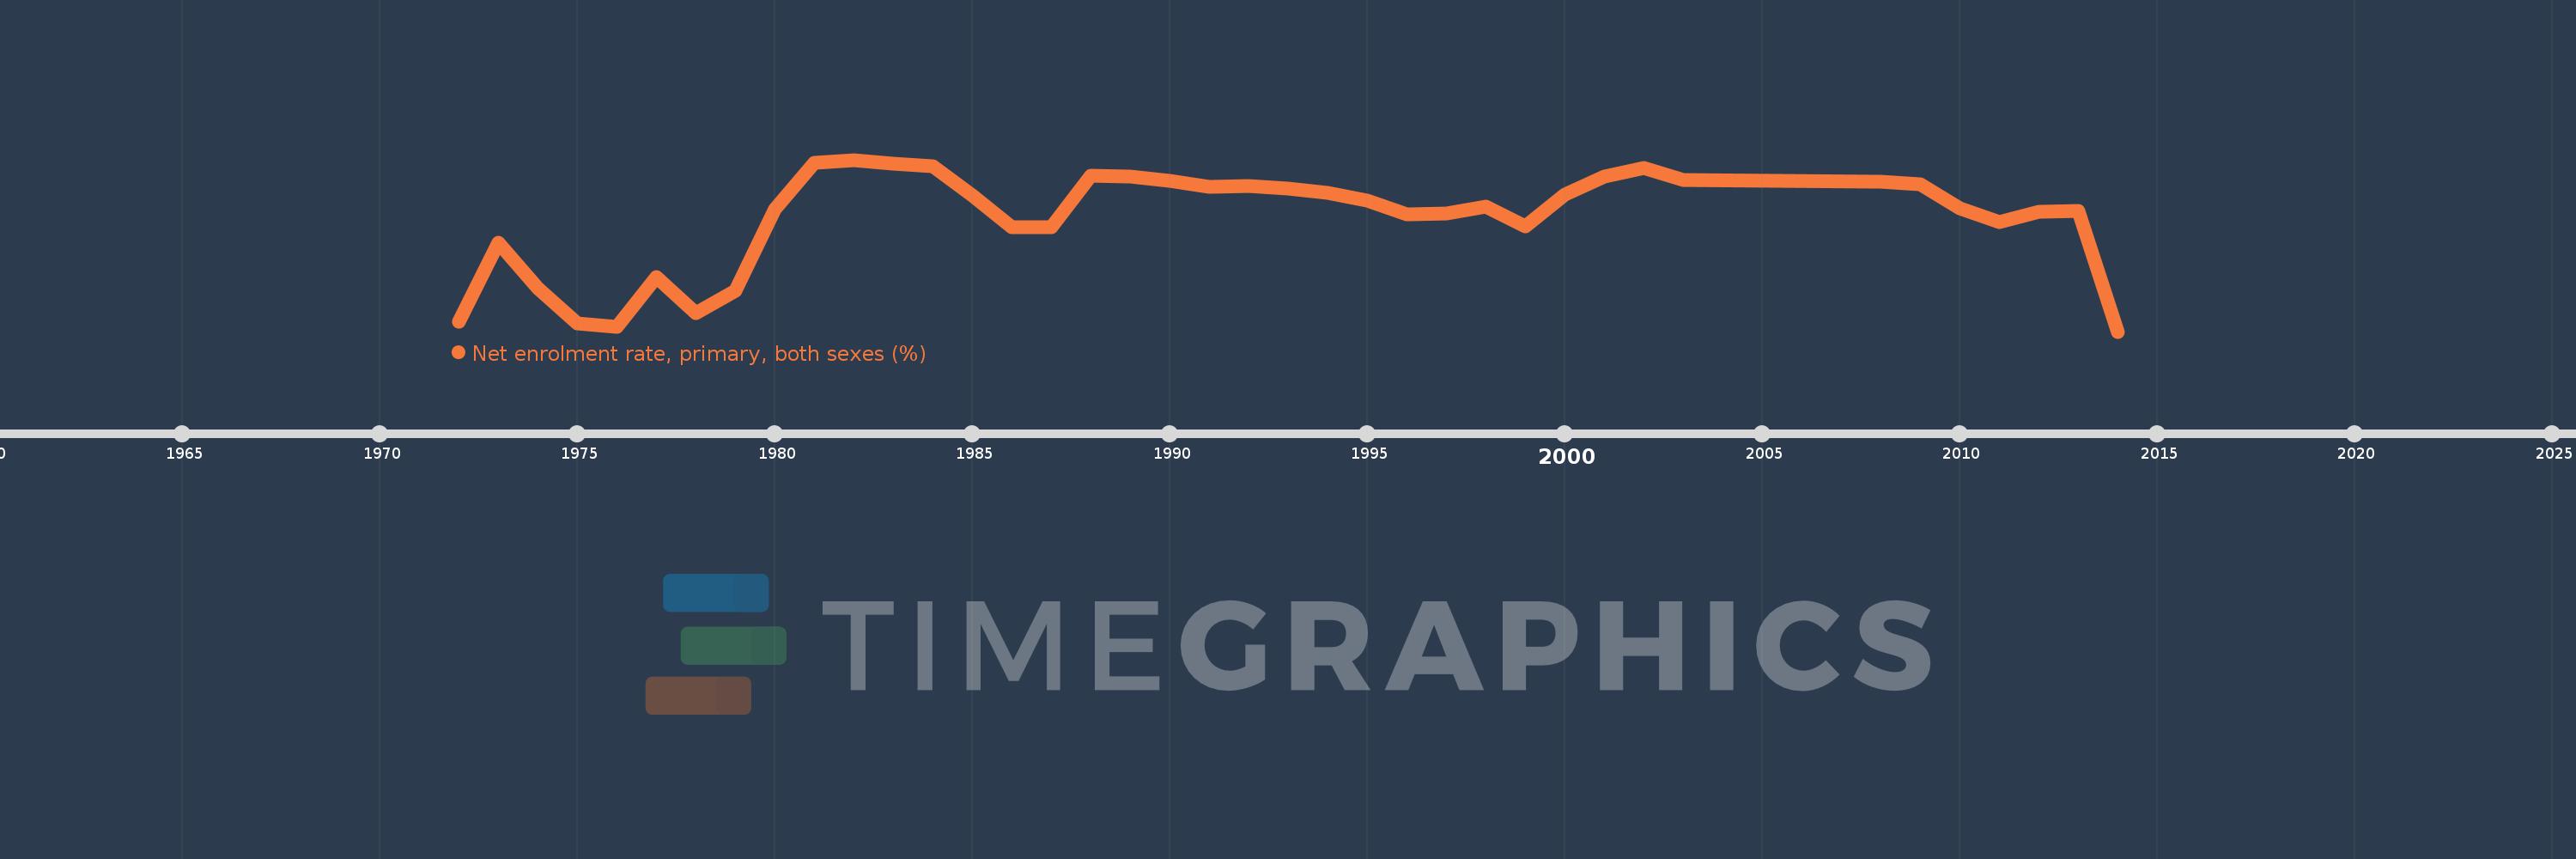
Net enrolment rate, primary, both sexes (%)
2014,2013,2012,2011,2010,2009,2008,2003,2002,2001,2000,1999,1998,1997,1996,1995,1994,1993,1992,1991,1990,1989,1988,1987,1986,1985,1984,1983,1982,1981,1980,1979,1978,1977,1976,1975,1974,1973,1972
This statistics in other country:
AfghanistanAlbaniaAlgeriaAngolaAntigua and BarbudaArab WorldArgentinaArmeniaArubaAustraliaAustriaAzerbaijanBahamas, TheBahrainBangladeshBarbadosBelarusBelgiumBelizeBeninBermudaBhutanBoliviaBosnia and HerzegovinaBotswanaBrazilBrunei DarussalamBulgariaBurkina FasoBurundiCabo VerdeCambodiaCameroonCanadaCaribbean small statesCentral African RepublicCentral Europe and the BalticsChadChileChinaColombiaComorosCongo, Dem. Rep.Congo, Rep.Costa RicaCote d'IvoireCroatiaCubaCyprusDenmarkDjiboutiDominicaDominican RepublicEarly-demographic dividendEast Asia & PacificEast Asia & Pacific (excluding high income)East Asia & Pacific (IDA & IBRD countries)EcuadorEgypt, Arab Rep.El SalvadorEquatorial GuineaEritreaEstoniaEthiopiaEuro areaEurope & Central AsiaEurope & Central Asia (excluding high income)Europe & Central Asia (IDA & IBRD countries)European UnionFijiFinlandFragile and conflict affected situationsFranceGabonGambia, TheGeorgiaGermanyGhanaGreeceGrenadaGuatemalaGuineaGuinea-BissauGuyanaHaitiHeavily indebted poor countries (HIPC)High incomeHondurasHong Kong SAR, ChinaHungaryIBRD onlyIcelandIDA & IBRD totalIDA blendIDA onlyIDA totalIndiaIndonesiaIran, Islamic Rep.IraqIrelandIsraelItalyJamaicaJapanJordanKazakhstanKenyaKiribatiKorea, Dem. People’s Rep.Korea, Rep.KuwaitKyrgyz RepublicLao PDRLate-demographic dividendLatin America & Caribbean Latin America & Caribbean (excluding high income)Latin America & the Caribbean (IDA & IBRD countries)LatviaLeast developed countries: UN classificationLebanonLesothoLiberiaLibyaLiechtensteinLithuaniaLow & middle incomeLow incomeLower middle incomeLuxembourgMacao SAR, ChinaMacedonia, FYRMadagascarMalawiMalaysiaMaldivesMaliMaltaMarshall IslandsMauritaniaMauritiusMexicoMicronesia, Fed. Sts.Middle East & North AfricaMiddle East & North Africa (excluding high income)Middle East & North Africa (IDA & IBRD countries)Middle incomeMoldovaMongoliaMontenegroMoroccoMozambiqueMyanmarNamibiaNauruNepalNetherlandsNew ZealandNicaraguaNigerNigeriaNorth AmericaNorwayOECD membersOmanOther small statesPacific island small statesPakistanPalauPanamaPapua New GuineaParaguayPeruPhilippinesPolandPortugalPost-demographic dividendPre-demographic dividendPuerto RicoQatarRomaniaRussian FederationRwandaSamoaSan MarinoSao Tome and PrincipeSaudi ArabiaSenegalSerbiaSeychellesSierra LeoneSloveniaSmall statesSolomon IslandsSomaliaSouth AfricaSouth AsiaSouth Asia (IDA & IBRD)South SudanSpainSri LankaSt. Kitts and NevisSt. LuciaSt. Vincent and the GrenadinesSub-Saharan Africa Sub-Saharan Africa (excluding high income)Sub-Saharan Africa (IDA & IBRD countries)SudanSurinameSwazilandSwedenSwitzerlandSyrian Arab RepublicTajikistanTanzaniaThailandTimor-LesteTogoTongaTrinidad and TobagoTunisiaTurkeyTuvaluUgandaUkraineUnited Arab EmiratesUnited KingdomUnited StatesUpper middle incomeUruguayUzbekistanVanuatuVenezuela, RBVietnamWest Bank and GazaWorldYemen, Rep.ZambiaZimbabwe Timeline:
This timeline shows a graph from 1972 to 2014 of Korea, Rep.. No data until 1971. Number of actual observations by date: 39.
Source name:
World Development Indicators
Source organization:
UNESCO Institute for Statistics
Categories, topics:
Education
Last updated:
apr 23, 2017
Indicators value changes by year
Minimum:
96.311
jan 1, 2014
Maximum:
99.944
jan 1, 1982
At the date of observation
Value
Absolute change
Change from previous value
jan 1, 1972
96.516
+96.516
0.0%
jan 1, 1973
98.189
+1.674
1.73%
jan 1, 1974
97.22
-0.969
-0.99%
jan 1, 1975
96.485
-0.735
-0.76%
jan 1, 1976
96.41
-0.075
-0.08%
jan 1, 1977
97.466
+1.056
1.1%
jan 1, 1978
96.699
-0.767
-0.79%
jan 1, 1979
97.167
+0.468
0.48%
jan 1, 1980
98.905
+1.738
1.79%
jan 1, 1981
99.873
+0.967
0.98%
jan 1, 1982
99.944
+0.071
0.07%
jan 1, 1983
99.859
-0.085
-0.08%
jan 1, 1984
99.814
-0.045
-0.05%
jan 1, 1985
99.199
-0.615
-0.62%
jan 1, 1986
98.513
-0.686
-0.69%
jan 1, 1987
98.511
-0.002
0.0%
jan 1, 1988
99.608
+1.096
1.11%
jan 1, 1989
99.587
-0.021
-0.02%
jan 1, 1990
99.491
-0.096
-0.1%
jan 1, 1991
99.376
-0.116
-0.12%
jan 1, 1992
99.399
+0.023
0.02%
jan 1, 1993
99.336
-0.063
-0.06%
jan 1, 1994
99.247
-0.088
-0.09%
jan 1, 1995
99.082
-0.166
-0.17%
jan 1, 1996
98.798
-0.283
-0.29%
jan 1, 1997
98.811
+0.013
0.01%
jan 1, 1998
98.963
+0.152
0.15%
jan 1, 1999
98.544
-0.419
-0.42%
jan 1, 2000
99.208
+0.664
0.67%
jan 1, 2001
99.586
+0.378
0.38%
jan 1, 2002
99.768
+0.182
0.18%
jan 1, 2003
99.518
-0.25
-0.25%
jan 1, 2008
99.473
-0.045
-0.05%
jan 1, 2009
99.426
-0.047
-0.05%
jan 1, 2010
98.918
-0.508
-0.51%
jan 1, 2011
98.62
-0.298
-0.3%
jan 1, 2012
98.851
+0.231
0.23%
jan 1, 2013
98.863
+0.012
0.01%
jan 1, 2014
96.311
-2.552
-2.58%
Ranking of countries by current statistics by years


Comments: