29
/
en
AIzaSyAYiBZKx7MnpbEhh9jyipgxe19OcubqV5w
April 1, 2024
30126
Euro area
EMU
false
2
1
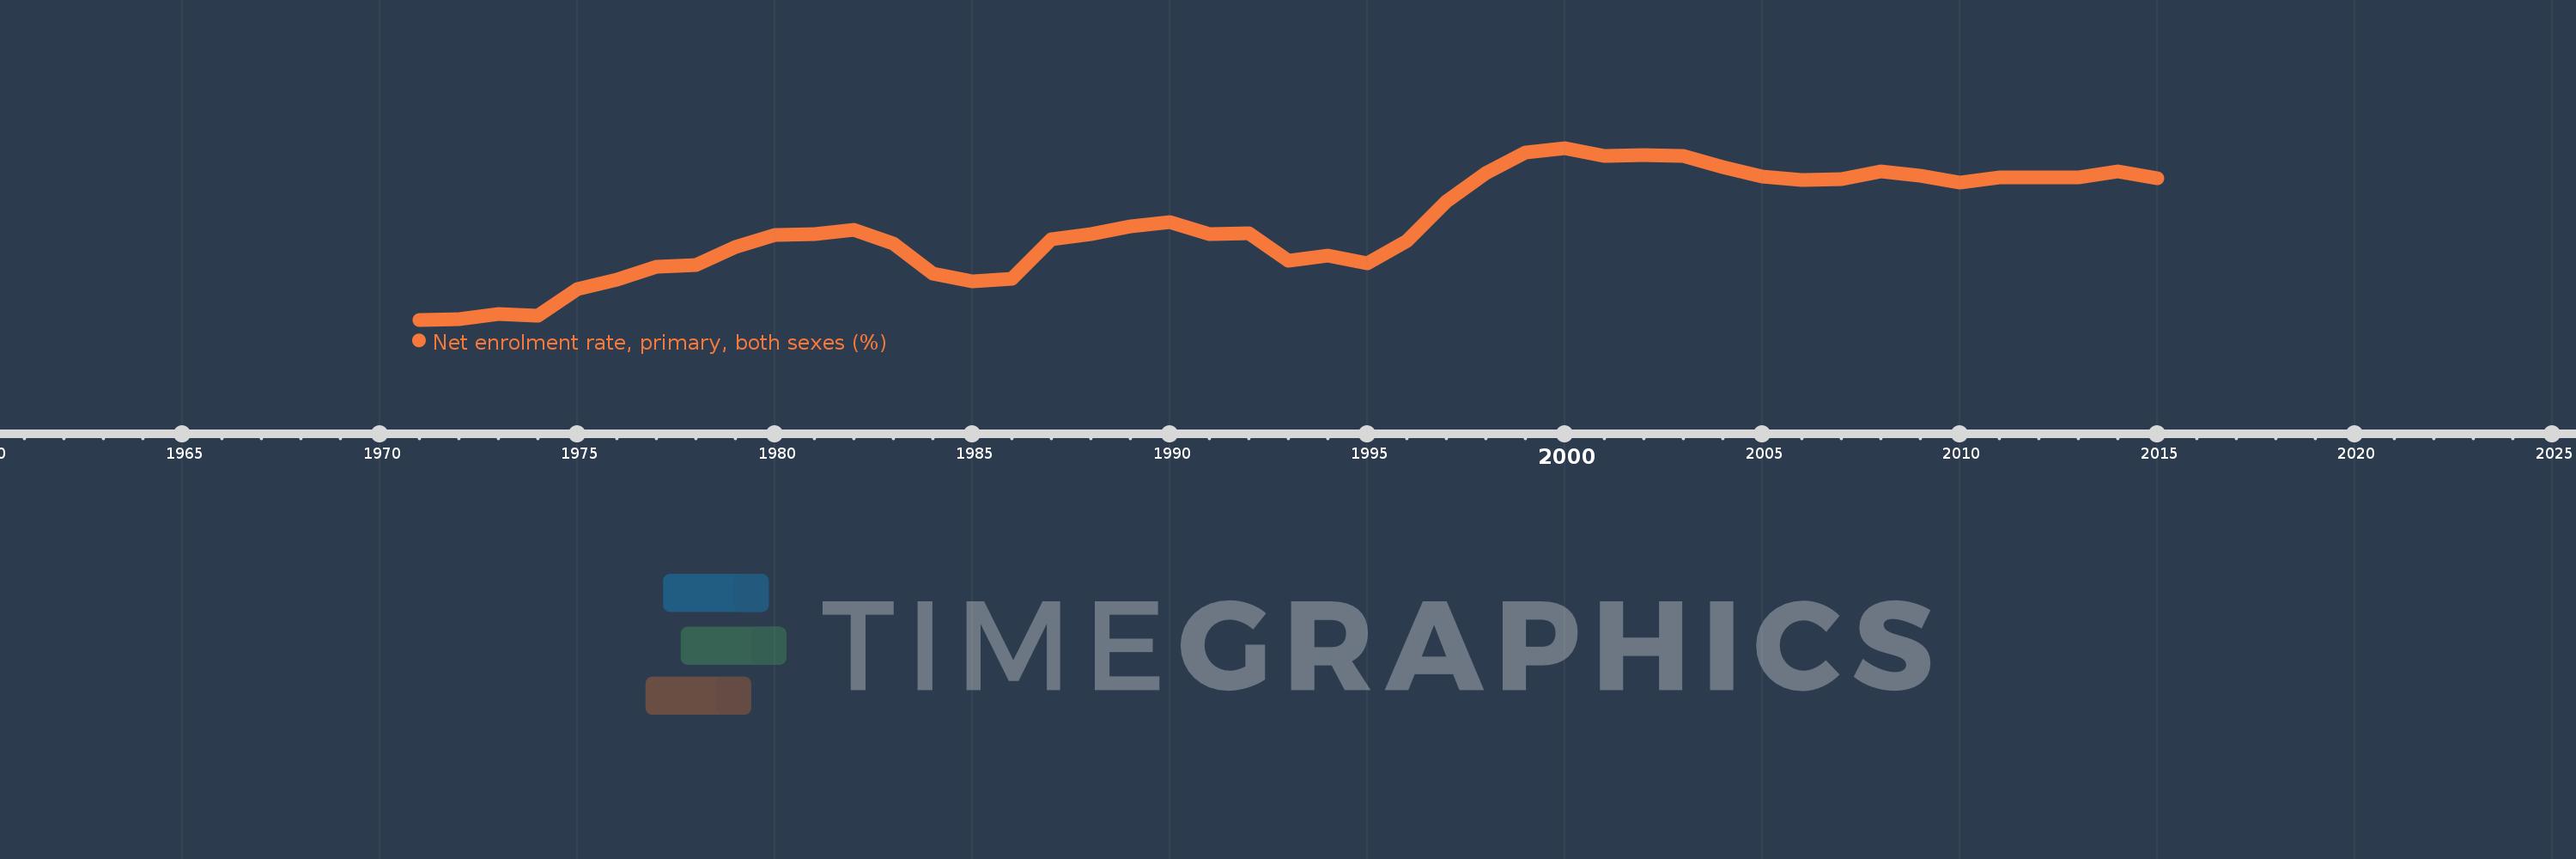
Net enrolment rate, primary, both sexes (%)
2015,2014,2013,2012,2011,2010,2009,2008,2007,2006,2005,2004,2003,2002,2001,2000,1999,1998,1997,1996,1995,1994,1993,1992,1991,1990,1989,1988,1987,1986,1985,1984,1983,1982,1981,1980,1979,1978,1977,1976,1975,1974,1973,1972,1971
This statistics in other country:
AfghanistanAlbaniaAlgeriaAngolaAntigua and BarbudaArab WorldArgentinaArmeniaArubaAustraliaAustriaAzerbaijanBahamas, TheBahrainBangladeshBarbadosBelarusBelgiumBelizeBeninBermudaBhutanBoliviaBosnia and HerzegovinaBotswanaBrazilBrunei DarussalamBulgariaBurkina FasoBurundiCabo VerdeCambodiaCameroonCanadaCaribbean small statesCentral African RepublicCentral Europe and the BalticsChadChileChinaColombiaComorosCongo, Dem. Rep.Congo, Rep.Costa RicaCote d'IvoireCroatiaCubaCyprusDenmarkDjiboutiDominicaDominican RepublicEarly-demographic dividendEast Asia & PacificEast Asia & Pacific (excluding high income)East Asia & Pacific (IDA & IBRD countries)EcuadorEgypt, Arab Rep.El SalvadorEquatorial GuineaEritreaEstoniaEthiopiaEuro areaEurope & Central AsiaEurope & Central Asia (excluding high income)Europe & Central Asia (IDA & IBRD countries)European UnionFijiFinlandFragile and conflict affected situationsFranceGabonGambia, TheGeorgiaGermanyGhanaGreeceGrenadaGuatemalaGuineaGuinea-BissauGuyanaHaitiHeavily indebted poor countries (HIPC)High incomeHondurasHong Kong SAR, ChinaHungaryIBRD onlyIcelandIDA & IBRD totalIDA blendIDA onlyIDA totalIndiaIndonesiaIran, Islamic Rep.IraqIrelandIsraelItalyJamaicaJapanJordanKazakhstanKenyaKiribatiKorea, Dem. People’s Rep.Korea, Rep.KuwaitKyrgyz RepublicLao PDRLate-demographic dividendLatin America & Caribbean Latin America & Caribbean (excluding high income)Latin America & the Caribbean (IDA & IBRD countries)LatviaLeast developed countries: UN classificationLebanonLesothoLiberiaLibyaLiechtensteinLithuaniaLow & middle incomeLow incomeLower middle incomeLuxembourgMacao SAR, ChinaMacedonia, FYRMadagascarMalawiMalaysiaMaldivesMaliMaltaMarshall IslandsMauritaniaMauritiusMexicoMicronesia, Fed. Sts.Middle East & North AfricaMiddle East & North Africa (excluding high income)Middle East & North Africa (IDA & IBRD countries)Middle incomeMoldovaMongoliaMontenegroMoroccoMozambiqueMyanmarNamibiaNauruNepalNetherlandsNew ZealandNicaraguaNigerNigeriaNorth AmericaNorwayOECD membersOmanOther small statesPacific island small statesPakistanPalauPanamaPapua New GuineaParaguayPeruPhilippinesPolandPortugalPost-demographic dividendPre-demographic dividendPuerto RicoQatarRomaniaRussian FederationRwandaSamoaSan MarinoSao Tome and PrincipeSaudi ArabiaSenegalSerbiaSeychellesSierra LeoneSloveniaSmall statesSolomon IslandsSomaliaSouth AfricaSouth AsiaSouth Asia (IDA & IBRD)South SudanSpainSri LankaSt. Kitts and NevisSt. LuciaSt. Vincent and the GrenadinesSub-Saharan Africa Sub-Saharan Africa (excluding high income)Sub-Saharan Africa (IDA & IBRD countries)SudanSurinameSwazilandSwedenSwitzerlandSyrian Arab RepublicTajikistanTanzaniaThailandTimor-LesteTogoTongaTrinidad and TobagoTunisiaTurkeyTuvaluUgandaUkraineUnited Arab EmiratesUnited KingdomUnited StatesUpper middle incomeUruguayUzbekistanVanuatuVenezuela, RBVietnamWest Bank and GazaWorldYemen, Rep.ZambiaZimbabwe Timeline:
This timeline shows a graph from 1971 to 2015 of Euro area. No data until 1970. Number of actual observations by date: 45.
Source name:
World Development Indicators
Source organization:
UNESCO Institute for Statistics
Categories, topics:
Education
Last updated:
apr 23, 2017
Indicators value changes by year
Minimum:
95.187
jan 1, 1971
At the date of observation
Value
Absolute change
Change from previous value
jan 1, 1971
95.187
+95.187
0.0%
jan 1, 1972
95.193
+0.006
0.01%
jan 1, 1973
95.312
+0.119
0.12%
jan 1, 1974
95.277
-0.034
-0.04%
jan 1, 1975
95.804
+0.527
0.55%
jan 1, 1976
96.007
+0.203
0.21%
jan 1, 1977
96.258
+0.251
0.26%
jan 1, 1978
96.292
+0.034
0.03%
jan 1, 1979
96.658
+0.366
0.38%
jan 1, 1980
96.905
+0.247
0.26%
jan 1, 1981
96.931
+0.026
0.03%
jan 1, 1982
97.003
+0.072
0.07%
jan 1, 1983
96.738
-0.265
-0.27%
jan 1, 1984
96.129
-0.608
-0.63%
jan 1, 1985
95.965
-0.165
-0.17%
jan 1, 1986
96.022
+0.057
0.06%
jan 1, 1987
96.824
+0.802
0.84%
jan 1, 1988
96.928
+0.104
0.11%
jan 1, 1989
97.081
+0.154
0.16%
jan 1, 1990
97.16
+0.079
0.08%
jan 1, 1991
96.922
-0.238
-0.25%
jan 1, 1992
96.942
+0.02
0.02%
jan 1, 1993
96.385
-0.556
-0.57%
jan 1, 1994
96.482
+0.097
0.1%
jan 1, 1995
96.326
-0.156
-0.16%
jan 1, 1996
96.789
+0.463
0.48%
jan 1, 1997
97.59
+0.801
0.83%
jan 1, 1998
98.158
+0.568
0.58%
jan 1, 1999
98.573
+0.415
0.42%
jan 1, 2000
98.67
+0.097
0.1%
jan 1, 2001
98.509
-0.161
-0.16%
jan 1, 2002
98.52
+0.011
0.01%
jan 1, 2003
98.502
-0.018
-0.02%
jan 1, 2004
98.289
-0.213
-0.22%
jan 1, 2005
98.083
-0.206
-0.21%
jan 1, 2006
98.021
-0.062
-0.06%
jan 1, 2007
98.033
+0.012
0.01%
jan 1, 2008
98.201
+0.168
0.17%
jan 1, 2009
98.108
-0.092
-0.09%
jan 1, 2010
97.961
-0.147
-0.15%
jan 1, 2011
98.065
+0.104
0.11%
jan 1, 2012
98.081
+0.015
0.02%
jan 1, 2013
98.077
-0.003
0.0%
jan 1, 2014
98.195
+0.117
0.12%
jan 1, 2015
98.05
-0.145
-0.15%
Ranking of countries by current statistics by years


Comments: