29
/
en
AIzaSyAYiBZKx7MnpbEhh9jyipgxe19OcubqV5w
April 1, 2024
29344
East Asia & Pacific (IDA & IBRD countries)
TEA
false
2
1
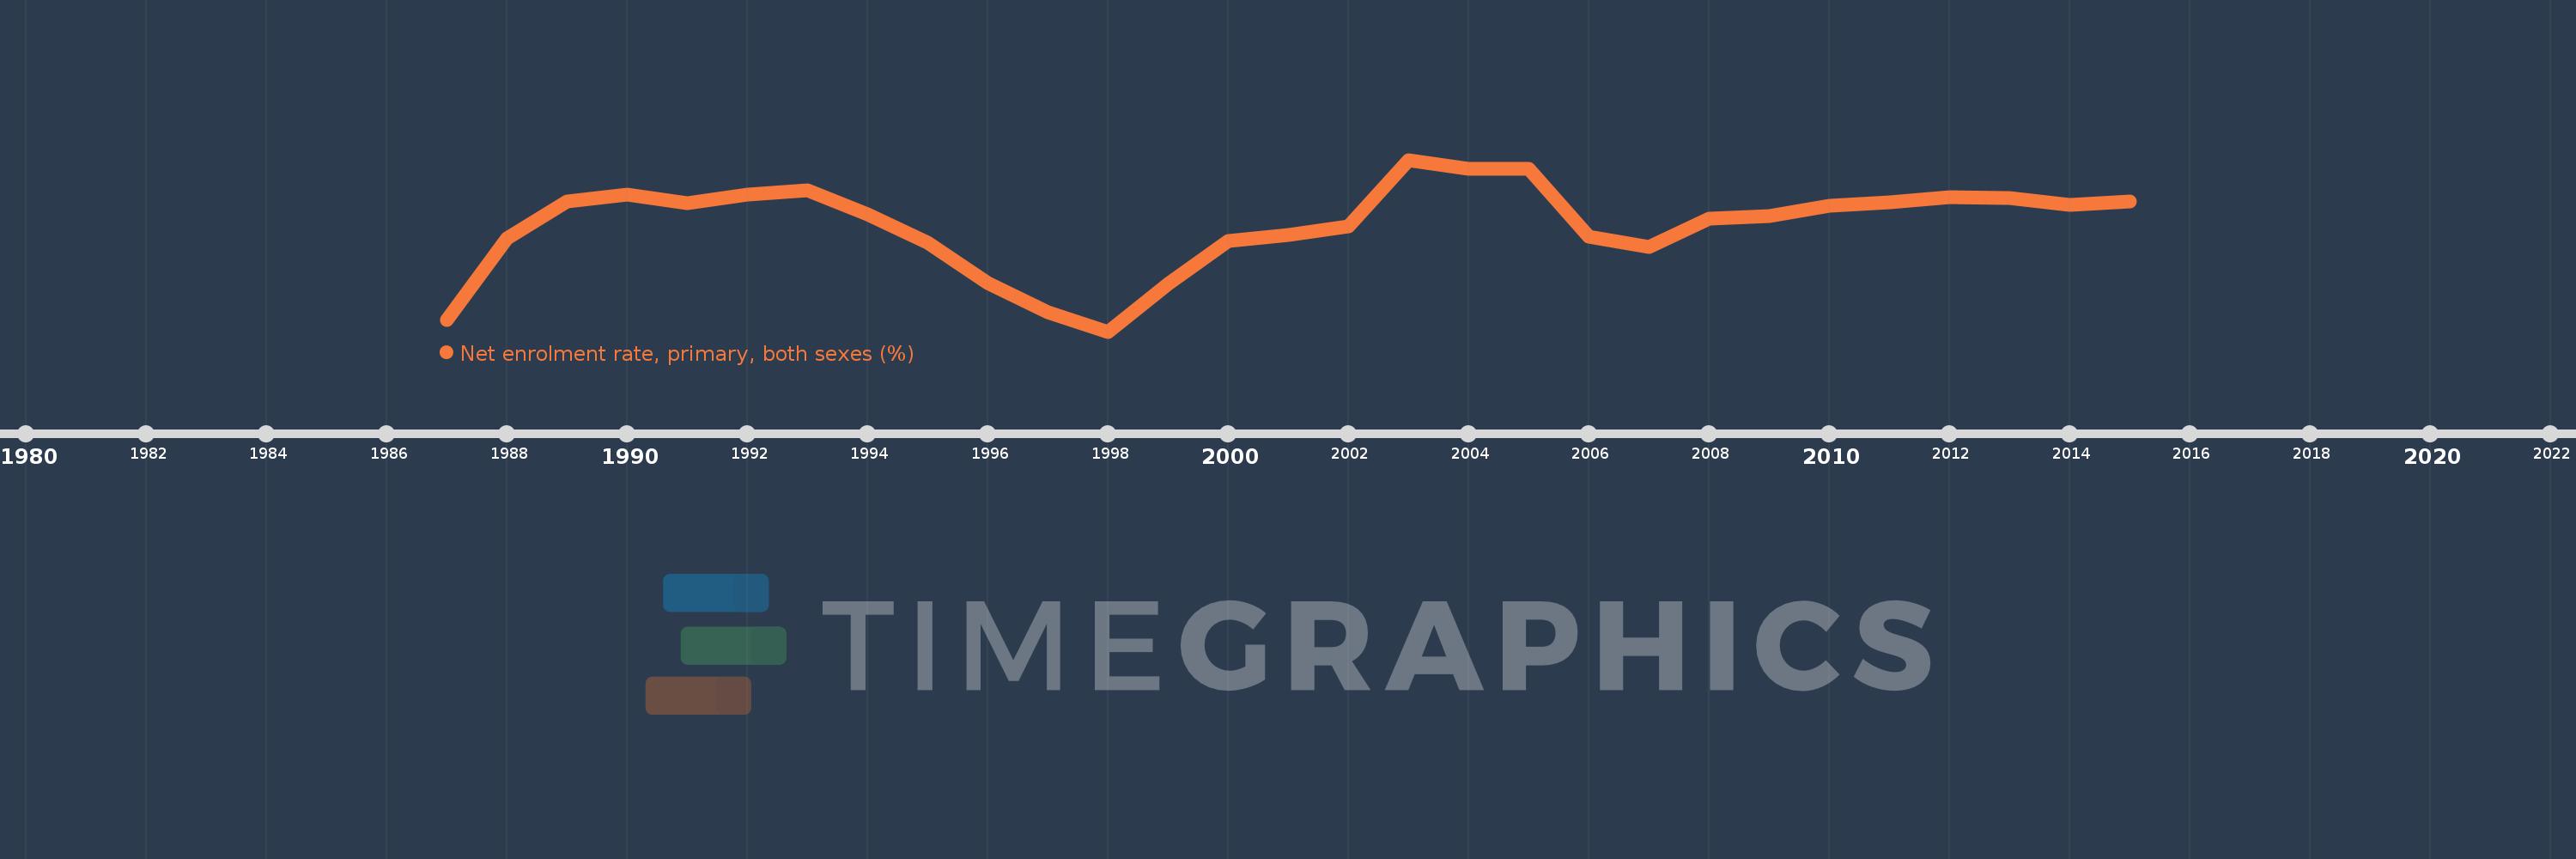
Net enrolment rate, primary, both sexes (%)
2015,2014,2013,2012,2011,2010,2009,2008,2007,2006,2005,2004,2003,2002,2001,2000,1999,1998,1997,1996,1995,1994,1993,1992,1991,1990,1989,1988,1987
This statistics in other country:
AfghanistanAlbaniaAlgeriaAngolaAntigua and BarbudaArab WorldArgentinaArmeniaArubaAustraliaAustriaAzerbaijanBahamas, TheBahrainBangladeshBarbadosBelarusBelgiumBelizeBeninBermudaBhutanBoliviaBosnia and HerzegovinaBotswanaBrazilBrunei DarussalamBulgariaBurkina FasoBurundiCabo VerdeCambodiaCameroonCanadaCaribbean small statesCentral African RepublicCentral Europe and the BalticsChadChileChinaColombiaComorosCongo, Dem. Rep.Congo, Rep.Costa RicaCote d'IvoireCroatiaCubaCyprusDenmarkDjiboutiDominicaDominican RepublicEarly-demographic dividendEast Asia & PacificEast Asia & Pacific (excluding high income)East Asia & Pacific (IDA & IBRD countries)EcuadorEgypt, Arab Rep.El SalvadorEquatorial GuineaEritreaEstoniaEthiopiaEuro areaEurope & Central AsiaEurope & Central Asia (excluding high income)Europe & Central Asia (IDA & IBRD countries)European UnionFijiFinlandFragile and conflict affected situationsFranceGabonGambia, TheGeorgiaGermanyGhanaGreeceGrenadaGuatemalaGuineaGuinea-BissauGuyanaHaitiHeavily indebted poor countries (HIPC)High incomeHondurasHong Kong SAR, ChinaHungaryIBRD onlyIcelandIDA & IBRD totalIDA blendIDA onlyIDA totalIndiaIndonesiaIran, Islamic Rep.IraqIrelandIsraelItalyJamaicaJapanJordanKazakhstanKenyaKiribatiKorea, Dem. People’s Rep.Korea, Rep.KuwaitKyrgyz RepublicLao PDRLate-demographic dividendLatin America & Caribbean Latin America & Caribbean (excluding high income)Latin America & the Caribbean (IDA & IBRD countries)LatviaLeast developed countries: UN classificationLebanonLesothoLiberiaLibyaLiechtensteinLithuaniaLow & middle incomeLow incomeLower middle incomeLuxembourgMacao SAR, ChinaMacedonia, FYRMadagascarMalawiMalaysiaMaldivesMaliMaltaMarshall IslandsMauritaniaMauritiusMexicoMicronesia, Fed. Sts.Middle East & North AfricaMiddle East & North Africa (excluding high income)Middle East & North Africa (IDA & IBRD countries)Middle incomeMoldovaMongoliaMontenegroMoroccoMozambiqueMyanmarNamibiaNauruNepalNetherlandsNew ZealandNicaraguaNigerNigeriaNorth AmericaNorwayOECD membersOmanOther small statesPacific island small statesPakistanPalauPanamaPapua New GuineaParaguayPeruPhilippinesPolandPortugalPost-demographic dividendPre-demographic dividendPuerto RicoQatarRomaniaRussian FederationRwandaSamoaSan MarinoSao Tome and PrincipeSaudi ArabiaSenegalSerbiaSeychellesSierra LeoneSloveniaSmall statesSolomon IslandsSomaliaSouth AfricaSouth AsiaSouth Asia (IDA & IBRD)South SudanSpainSri LankaSt. Kitts and NevisSt. LuciaSt. Vincent and the GrenadinesSub-Saharan Africa Sub-Saharan Africa (excluding high income)Sub-Saharan Africa (IDA & IBRD countries)SudanSurinameSwazilandSwedenSwitzerlandSyrian Arab RepublicTajikistanTanzaniaThailandTimor-LesteTogoTongaTrinidad and TobagoTunisiaTurkeyTuvaluUgandaUkraineUnited Arab EmiratesUnited KingdomUnited StatesUpper middle incomeUruguayUzbekistanVanuatuVenezuela, RBVietnamWest Bank and GazaWorldYemen, Rep.ZambiaZimbabwe Timeline:
This timeline shows a graph from 1987 to 2015 of East Asia & Pacific (IDA & IBRD countries). No data until 1986. Number of actual observations by date: 29.
Source name:
World Development Indicators
Source organization:
UNESCO Institute for Statistics
Categories, topics:
Education
Last updated:
apr 23, 2017
Indicators value changes by year
Minimum:
90.965
jan 1, 1998
Maximum:
96.751
jan 1, 2003
At the date of observation
Value
Absolute change
Change from previous value
jan 1, 1987
91.366
+91.366
0.0%
jan 1, 1988
94.116
+2.75
3.01%
jan 1, 1989
95.362
+1.245
1.32%
jan 1, 1990
95.587
+0.226
0.24%
jan 1, 1991
95.28
-0.307
-0.32%
jan 1, 1992
95.582
+0.302
0.32%
jan 1, 1993
95.722
+0.139
0.15%
jan 1, 1994
94.926
-0.795
-0.83%
jan 1, 1995
93.955
-0.972
-1.02%
jan 1, 1996
92.601
-1.354
-1.44%
jan 1, 1997
91.606
-0.995
-1.07%
jan 1, 1998
90.965
-0.64
-0.7%
jan 1, 1999
92.559
+1.593
1.75%
jan 1, 2000
94.014
+1.455
1.57%
jan 1, 2001
94.213
+0.199
0.21%
jan 1, 2002
94.505
+0.292
0.31%
jan 1, 2003
96.751
+2.247
2.38%
jan 1, 2004
96.458
-0.293
-0.3%
jan 1, 2005
96.435
-0.023
-0.02%
jan 1, 2006
94.16
-2.275
-2.36%
jan 1, 2007
93.809
-0.351
-0.37%
jan 1, 2008
94.78
+0.971
1.04%
jan 1, 2009
94.845
+0.065
0.07%
jan 1, 2010
95.194
+0.349
0.37%
jan 1, 2011
95.314
+0.119
0.13%
jan 1, 2012
95.504
+0.19
0.2%
jan 1, 2013
95.456
-0.048
-0.05%
jan 1, 2014
95.24
-0.216
-0.23%
jan 1, 2015
95.362
+0.122
0.13%
Ranking of countries by current statistics by years


Comments: