29
/
en
AIzaSyAYiBZKx7MnpbEhh9jyipgxe19OcubqV5w
April 1, 2024
209596
New Zealand
NZL
true
2
1
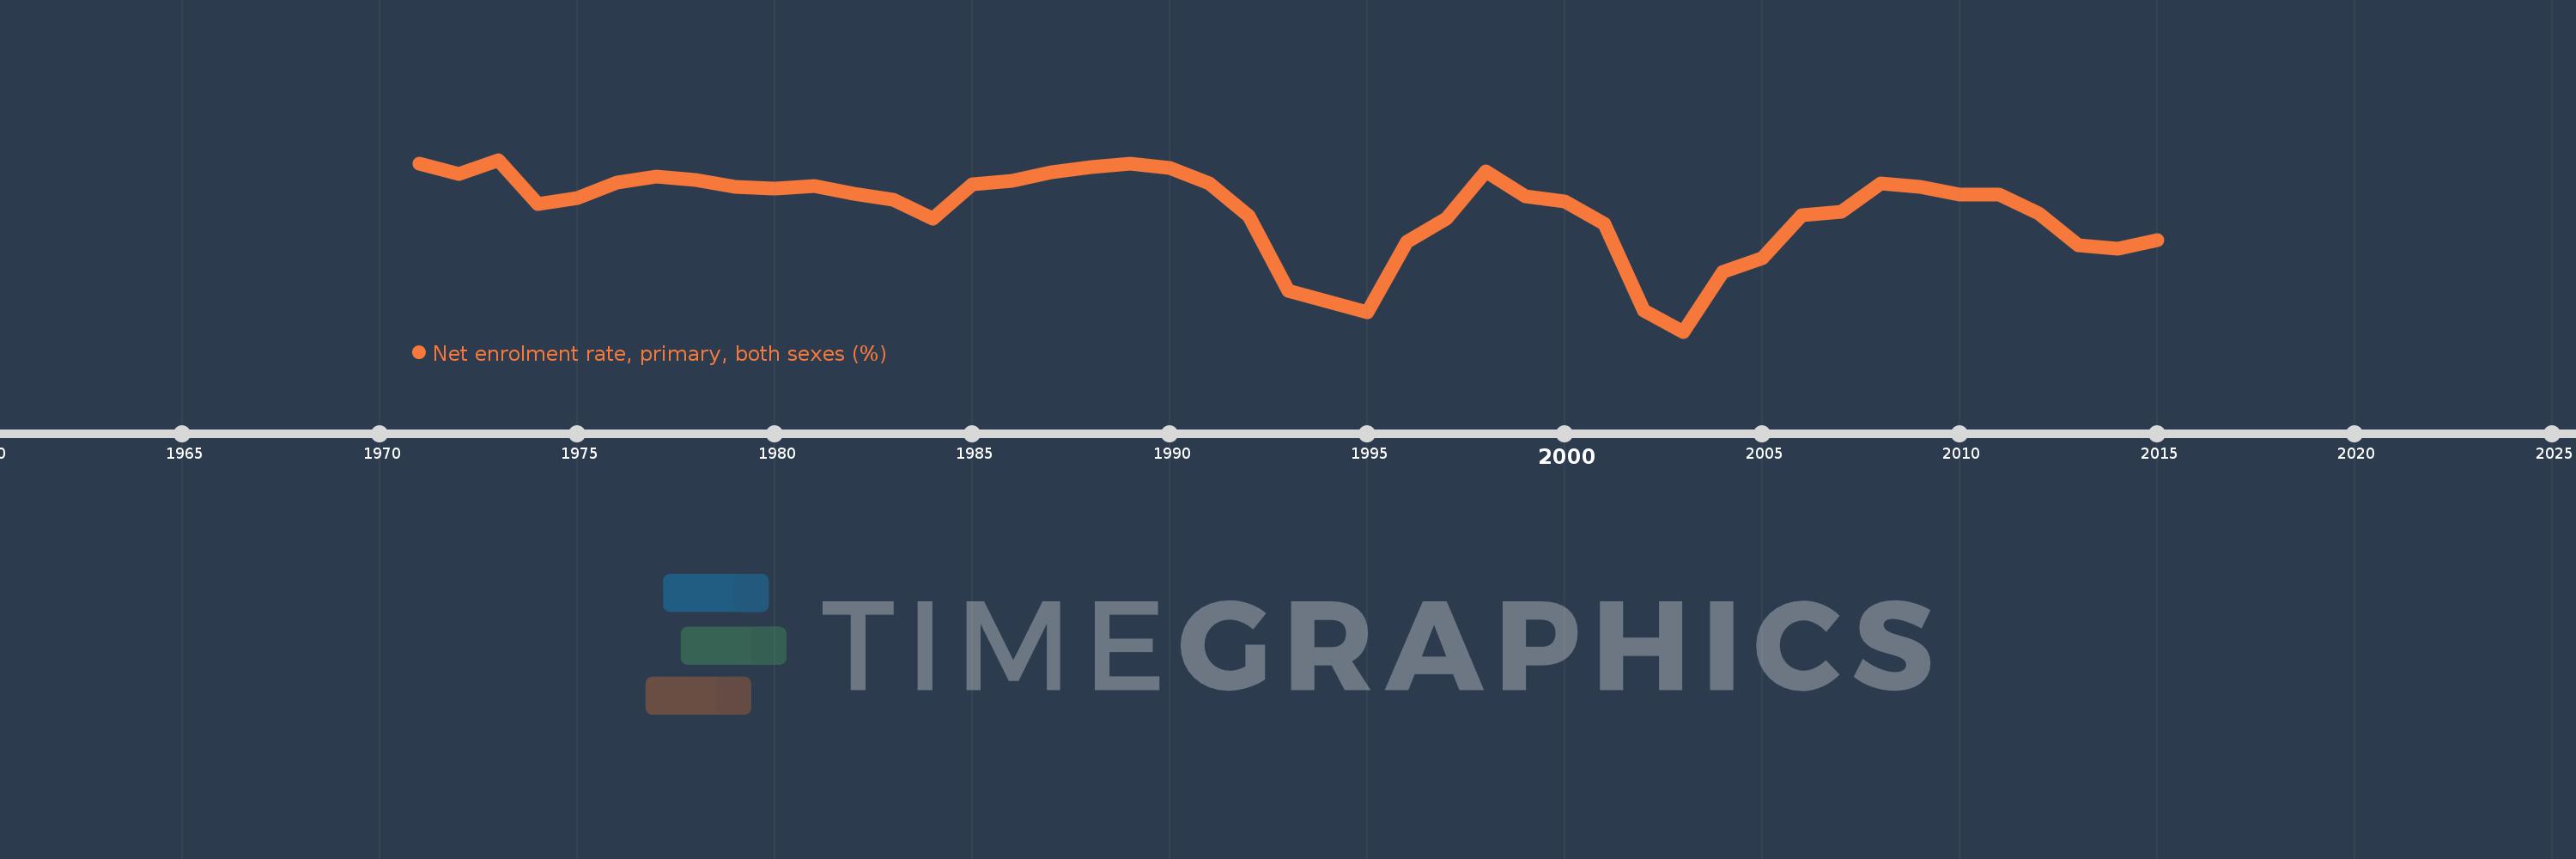
Net enrolment rate, primary, both sexes (%)
2015,2014,2013,2012,2011,2010,2009,2008,2007,2006,2005,2004,2003,2002,2001,2000,1999,1998,1997,1996,1995,1993,1992,1991,1990,1989,1988,1987,1986,1985,1984,1983,1982,1981,1980,1979,1978,1977,1976,1975,1974,1973,1972,1971
This statistics in other country:
AfghanistanAlbaniaAlgeriaAngolaAntigua and BarbudaArab WorldArgentinaArmeniaArubaAustraliaAustriaAzerbaijanBahamas, TheBahrainBangladeshBarbadosBelarusBelgiumBelizeBeninBermudaBhutanBoliviaBosnia and HerzegovinaBotswanaBrazilBrunei DarussalamBulgariaBurkina FasoBurundiCabo VerdeCambodiaCameroonCanadaCaribbean small statesCentral African RepublicCentral Europe and the BalticsChadChileChinaColombiaComorosCongo, Dem. Rep.Congo, Rep.Costa RicaCote d'IvoireCroatiaCubaCyprusDenmarkDjiboutiDominicaDominican RepublicEarly-demographic dividendEast Asia & PacificEast Asia & Pacific (excluding high income)East Asia & Pacific (IDA & IBRD countries)EcuadorEgypt, Arab Rep.El SalvadorEquatorial GuineaEritreaEstoniaEthiopiaEuro areaEurope & Central AsiaEurope & Central Asia (excluding high income)Europe & Central Asia (IDA & IBRD countries)European UnionFijiFinlandFragile and conflict affected situationsFranceGabonGambia, TheGeorgiaGermanyGhanaGreeceGrenadaGuatemalaGuineaGuinea-BissauGuyanaHaitiHeavily indebted poor countries (HIPC)High incomeHondurasHong Kong SAR, ChinaHungaryIBRD onlyIcelandIDA & IBRD totalIDA blendIDA onlyIDA totalIndiaIndonesiaIran, Islamic Rep.IraqIrelandIsraelItalyJamaicaJapanJordanKazakhstanKenyaKiribatiKorea, Dem. People’s Rep.Korea, Rep.KuwaitKyrgyz RepublicLao PDRLate-demographic dividendLatin America & Caribbean Latin America & Caribbean (excluding high income)Latin America & the Caribbean (IDA & IBRD countries)LatviaLeast developed countries: UN classificationLebanonLesothoLiberiaLibyaLiechtensteinLithuaniaLow & middle incomeLow incomeLower middle incomeLuxembourgMacao SAR, ChinaMacedonia, FYRMadagascarMalawiMalaysiaMaldivesMaliMaltaMarshall IslandsMauritaniaMauritiusMexicoMicronesia, Fed. Sts.Middle East & North AfricaMiddle East & North Africa (excluding high income)Middle East & North Africa (IDA & IBRD countries)Middle incomeMoldovaMongoliaMontenegroMoroccoMozambiqueMyanmarNamibiaNauruNepalNetherlandsNew ZealandNicaraguaNigerNigeriaNorth AmericaNorwayOECD membersOmanOther small statesPacific island small statesPakistanPalauPanamaPapua New GuineaParaguayPeruPhilippinesPolandPortugalPost-demographic dividendPre-demographic dividendPuerto RicoQatarRomaniaRussian FederationRwandaSamoaSan MarinoSao Tome and PrincipeSaudi ArabiaSenegalSerbiaSeychellesSierra LeoneSloveniaSmall statesSolomon IslandsSomaliaSouth AfricaSouth AsiaSouth Asia (IDA & IBRD)South SudanSpainSri LankaSt. Kitts and NevisSt. LuciaSt. Vincent and the GrenadinesSub-Saharan Africa Sub-Saharan Africa (excluding high income)Sub-Saharan Africa (IDA & IBRD countries)SudanSurinameSwazilandSwedenSwitzerlandSyrian Arab RepublicTajikistanTanzaniaThailandTimor-LesteTogoTongaTrinidad and TobagoTunisiaTurkeyTuvaluUgandaUkraineUnited Arab EmiratesUnited KingdomUnited StatesUpper middle incomeUruguayUzbekistanVanuatuVenezuela, RBVietnamWest Bank and GazaWorldYemen, Rep.ZambiaZimbabwe Timeline:
This timeline shows a graph from 1971 to 2015 of New Zealand. No data until 1970. Number of actual observations by date: 44.
Source name:
World Development Indicators
Source organization:
UNESCO Institute for Statistics
Categories, topics:
Education
Last updated:
apr 23, 2017
Indicators value changes by year
Minimum:
96.655
jan 1, 2003
Maximum:
99.979
jan 1, 1973
At the date of observation
Value
Absolute change
Change from previous value
jan 1, 1971
99.899
+99.899
0.0%
jan 1, 1972
99.704
-0.195
-0.19%
jan 1, 1973
99.979
+0.275
0.28%
jan 1, 1974
99.116
-0.863
-0.86%
jan 1, 1975
99.244
+0.128
0.13%
jan 1, 1976
99.54
+0.296
0.3%
jan 1, 1977
99.66
+0.12
0.12%
jan 1, 1978
99.581
-0.079
-0.08%
jan 1, 1979
99.45
-0.131
-0.13%
jan 1, 1980
99.429
-0.022
-0.02%
jan 1, 1981
99.48
+0.051
0.05%
jan 1, 1982
99.325
-0.155
-0.16%
jan 1, 1983
99.213
-0.112
-0.11%
jan 1, 1984
98.844
-0.369
-0.37%
jan 1, 1985
99.501
+0.657
0.66%
jan 1, 1986
99.565
+0.064
0.06%
jan 1, 1987
99.739
+0.174
0.17%
jan 1, 1988
99.842
+0.103
0.1%
jan 1, 1989
99.905
+0.064
0.06%
jan 1, 1990
99.826
-0.079
-0.08%
jan 1, 1991
99.525
-0.301
-0.3%
jan 1, 1992
98.895
-0.63
-0.63%
jan 1, 1993
97.448
-1.447
-1.46%
jan 1, 1995
97.034
-0.414
-0.43%
jan 1, 1996
98.386
+1.352
1.39%
jan 1, 1997
98.843
+0.457
0.46%
jan 1, 1998
99.755
+0.912
0.92%
jan 1, 1999
99.28
-0.475
-0.48%
jan 1, 2000
99.173
-0.106
-0.11%
jan 1, 2001
98.738
-0.435
-0.44%
jan 1, 2002
97.064
-1.674
-1.7%
jan 1, 2003
96.655
-0.409
-0.42%
jan 1, 2004
97.802
+1.147
1.19%
jan 1, 2005
98.081
+0.279
0.29%
jan 1, 2006
98.904
+0.824
0.84%
jan 1, 2007
98.968
+0.064
0.06%
jan 1, 2008
99.53
+0.562
0.57%
jan 1, 2009
99.459
-0.071
-0.07%
jan 1, 2010
99.298
-0.161
-0.16%
jan 1, 2011
99.314
+0.015
0.02%
jan 1, 2012
98.941
-0.373
-0.38%
jan 1, 2013
98.332
-0.608
-0.61%
jan 1, 2014
98.266
-0.066
-0.07%
jan 1, 2015
98.429
+0.163
0.17%
Ranking of countries by current statistics by years


Comments: