29
/
en
AIzaSyAYiBZKx7MnpbEhh9jyipgxe19OcubqV5w
April 1, 2024
112619
Costa Rica
CRI
true
2
1
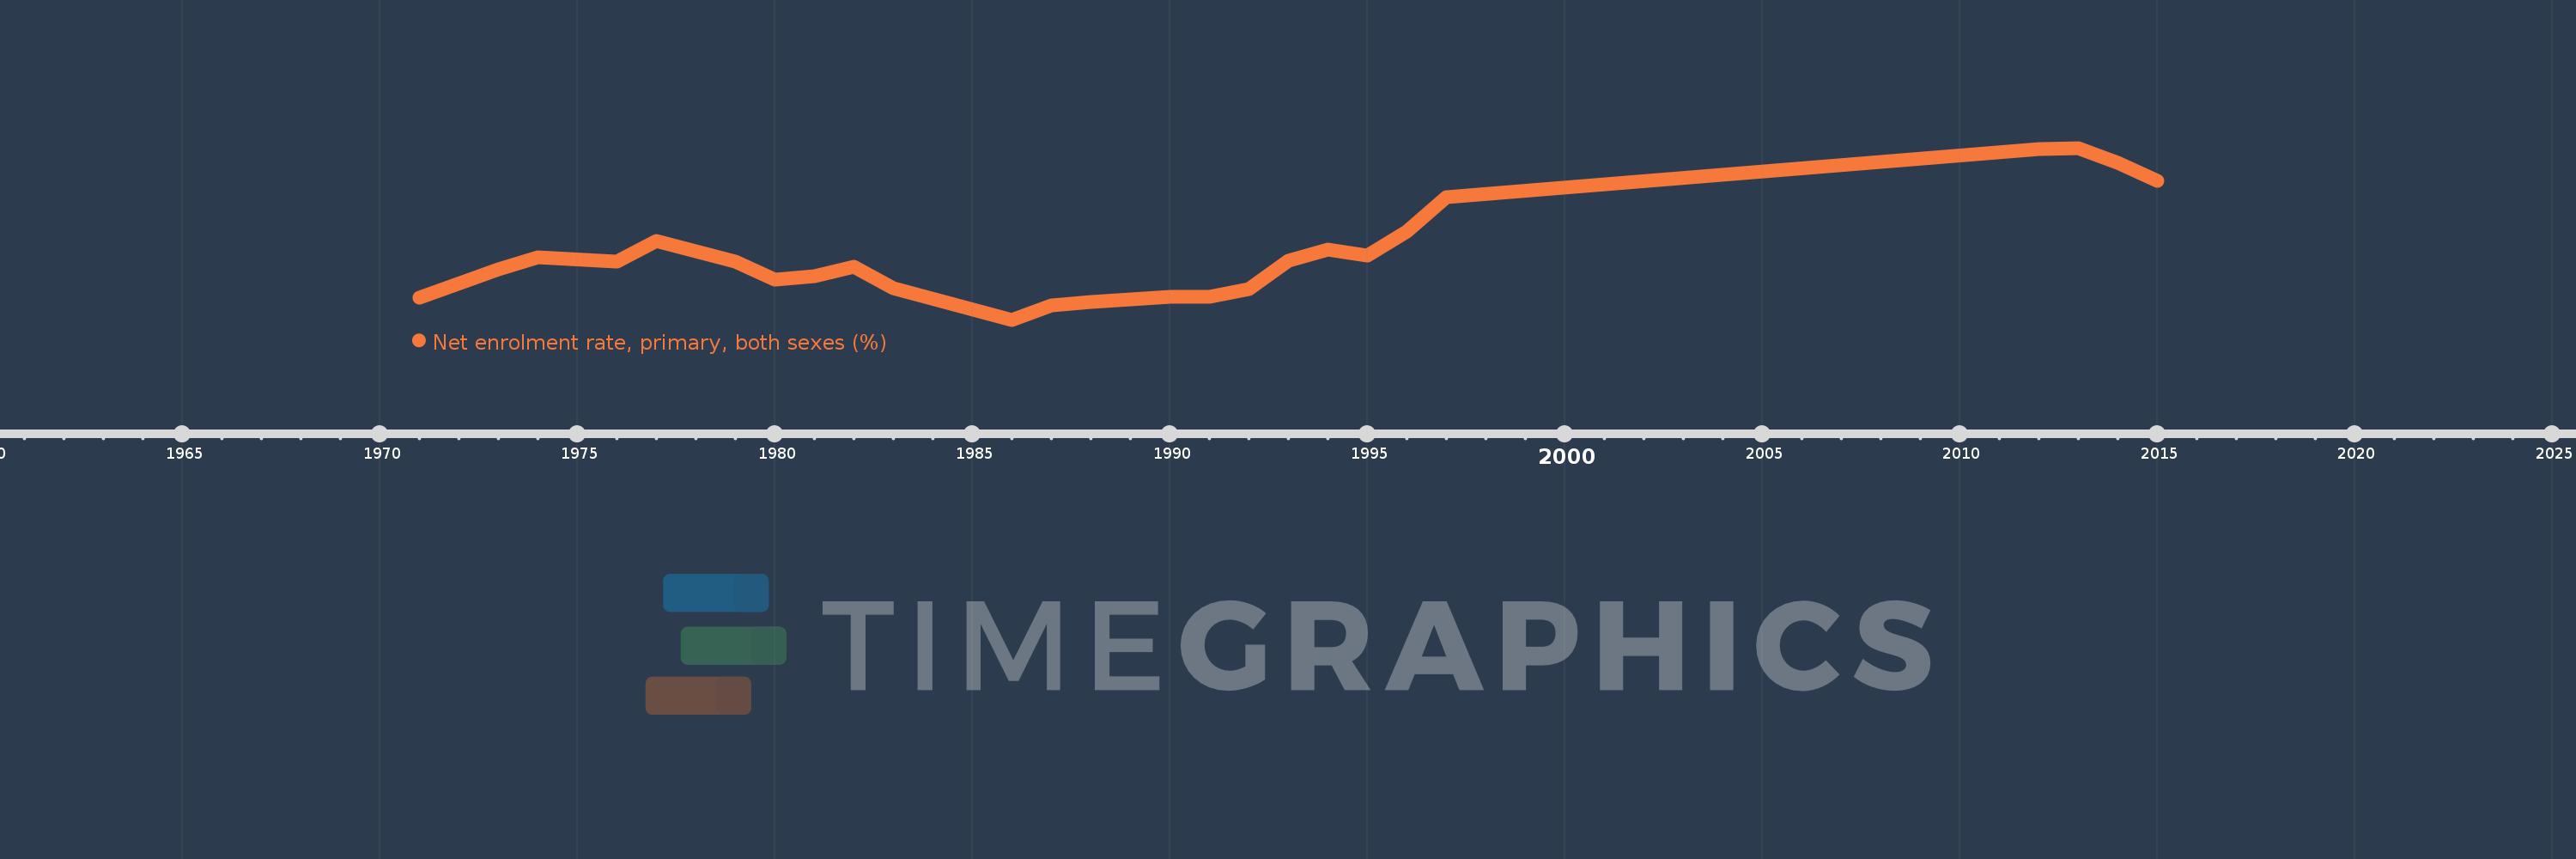
Net enrolment rate, primary, both sexes (%)
2015,2014,2013,2012,1997,1996,1995,1994,1993,1992,1991,1990,1988,1987,1986,1983,1982,1981,1980,1979,1977,1976,1974,1973,1971
This statistics in other country:
AfghanistanAlbaniaAlgeriaAngolaAntigua and BarbudaArab WorldArgentinaArmeniaArubaAustraliaAustriaAzerbaijanBahamas, TheBahrainBangladeshBarbadosBelarusBelgiumBelizeBeninBermudaBhutanBoliviaBosnia and HerzegovinaBotswanaBrazilBrunei DarussalamBulgariaBurkina FasoBurundiCabo VerdeCambodiaCameroonCanadaCaribbean small statesCentral African RepublicCentral Europe and the BalticsChadChileChinaColombiaComorosCongo, Dem. Rep.Congo, Rep.Costa RicaCote d'IvoireCroatiaCubaCyprusDenmarkDjiboutiDominicaDominican RepublicEarly-demographic dividendEast Asia & PacificEast Asia & Pacific (excluding high income)East Asia & Pacific (IDA & IBRD countries)EcuadorEgypt, Arab Rep.El SalvadorEquatorial GuineaEritreaEstoniaEthiopiaEuro areaEurope & Central AsiaEurope & Central Asia (excluding high income)Europe & Central Asia (IDA & IBRD countries)European UnionFijiFinlandFragile and conflict affected situationsFranceGabonGambia, TheGeorgiaGermanyGhanaGreeceGrenadaGuatemalaGuineaGuinea-BissauGuyanaHaitiHeavily indebted poor countries (HIPC)High incomeHondurasHong Kong SAR, ChinaHungaryIBRD onlyIcelandIDA & IBRD totalIDA blendIDA onlyIDA totalIndiaIndonesiaIran, Islamic Rep.IraqIrelandIsraelItalyJamaicaJapanJordanKazakhstanKenyaKiribatiKorea, Dem. People’s Rep.Korea, Rep.KuwaitKyrgyz RepublicLao PDRLate-demographic dividendLatin America & Caribbean Latin America & Caribbean (excluding high income)Latin America & the Caribbean (IDA & IBRD countries)LatviaLeast developed countries: UN classificationLebanonLesothoLiberiaLibyaLiechtensteinLithuaniaLow & middle incomeLow incomeLower middle incomeLuxembourgMacao SAR, ChinaMacedonia, FYRMadagascarMalawiMalaysiaMaldivesMaliMaltaMarshall IslandsMauritaniaMauritiusMexicoMicronesia, Fed. Sts.Middle East & North AfricaMiddle East & North Africa (excluding high income)Middle East & North Africa (IDA & IBRD countries)Middle incomeMoldovaMongoliaMontenegroMoroccoMozambiqueMyanmarNamibiaNauruNepalNetherlandsNew ZealandNicaraguaNigerNigeriaNorth AmericaNorwayOECD membersOmanOther small statesPacific island small statesPakistanPalauPanamaPapua New GuineaParaguayPeruPhilippinesPolandPortugalPost-demographic dividendPre-demographic dividendPuerto RicoQatarRomaniaRussian FederationRwandaSamoaSan MarinoSao Tome and PrincipeSaudi ArabiaSenegalSerbiaSeychellesSierra LeoneSloveniaSmall statesSolomon IslandsSomaliaSouth AfricaSouth AsiaSouth Asia (IDA & IBRD)South SudanSpainSri LankaSt. Kitts and NevisSt. LuciaSt. Vincent and the GrenadinesSub-Saharan Africa Sub-Saharan Africa (excluding high income)Sub-Saharan Africa (IDA & IBRD countries)SudanSurinameSwazilandSwedenSwitzerlandSyrian Arab RepublicTajikistanTanzaniaThailandTimor-LesteTogoTongaTrinidad and TobagoTunisiaTurkeyTuvaluUgandaUkraineUnited Arab EmiratesUnited KingdomUnited StatesUpper middle incomeUruguayUzbekistanVanuatuVenezuela, RBVietnamWest Bank and GazaWorldYemen, Rep.ZambiaZimbabwe Timeline:
This timeline shows a graph from 1971 to 2015 of Costa Rica. No data until 1970. Number of actual observations by date: 25.
Source name:
World Development Indicators
Source organization:
UNESCO Institute for Statistics
Categories, topics:
Education
Last updated:
apr 23, 2017
Indicators value changes by year
Minimum:
86.085
jan 1, 1986
Maximum:
98.487
jan 1, 2013
At the date of observation
Value
Absolute change
Change from previous value
jan 1, 1971
87.666
+87.666
0.0%
jan 1, 1973
89.716
+2.051
2.34%
jan 1, 1974
90.575
+0.858
0.96%
jan 1, 1976
90.27
-0.305
-0.34%
jan 1, 1977
91.79
+1.52
1.68%
jan 1, 1979
90.269
-1.521
-1.66%
jan 1, 1980
88.978
-1.292
-1.43%
jan 1, 1981
89.215
+0.237
0.27%
jan 1, 1982
89.925
+0.711
0.8%
jan 1, 1983
88.348
-1.577
-1.75%
jan 1, 1986
86.085
-2.264
-2.56%
jan 1, 1987
87.113
+1.028
1.19%
jan 1, 1988
87.342
+0.229
0.26%
jan 1, 1990
87.727
+0.385
0.44%
jan 1, 1991
87.734
+0.006
0.01%
jan 1, 1992
88.286
+0.552
0.63%
jan 1, 1993
90.345
+2.059
2.33%
jan 1, 1994
91.138
+0.793
0.88%
jan 1, 1995
90.733
-0.405
-0.44%
jan 1, 1996
92.448
+1.716
1.89%
jan 1, 1997
94.912
+2.464
2.67%
jan 1, 2012
98.4
+3.488
3.67%
jan 1, 2013
98.487
+0.087
0.09%
jan 1, 2014
97.418
-1.068
-1.08%
jan 1, 2015
96.132
-1.287
-1.32%
Ranking of countries by current statistics by years


Comments: