29
/
en
AIzaSyAYiBZKx7MnpbEhh9jyipgxe19OcubqV5w
April 1, 2024
30957
Europe & Central Asia
ECS
false
2
1
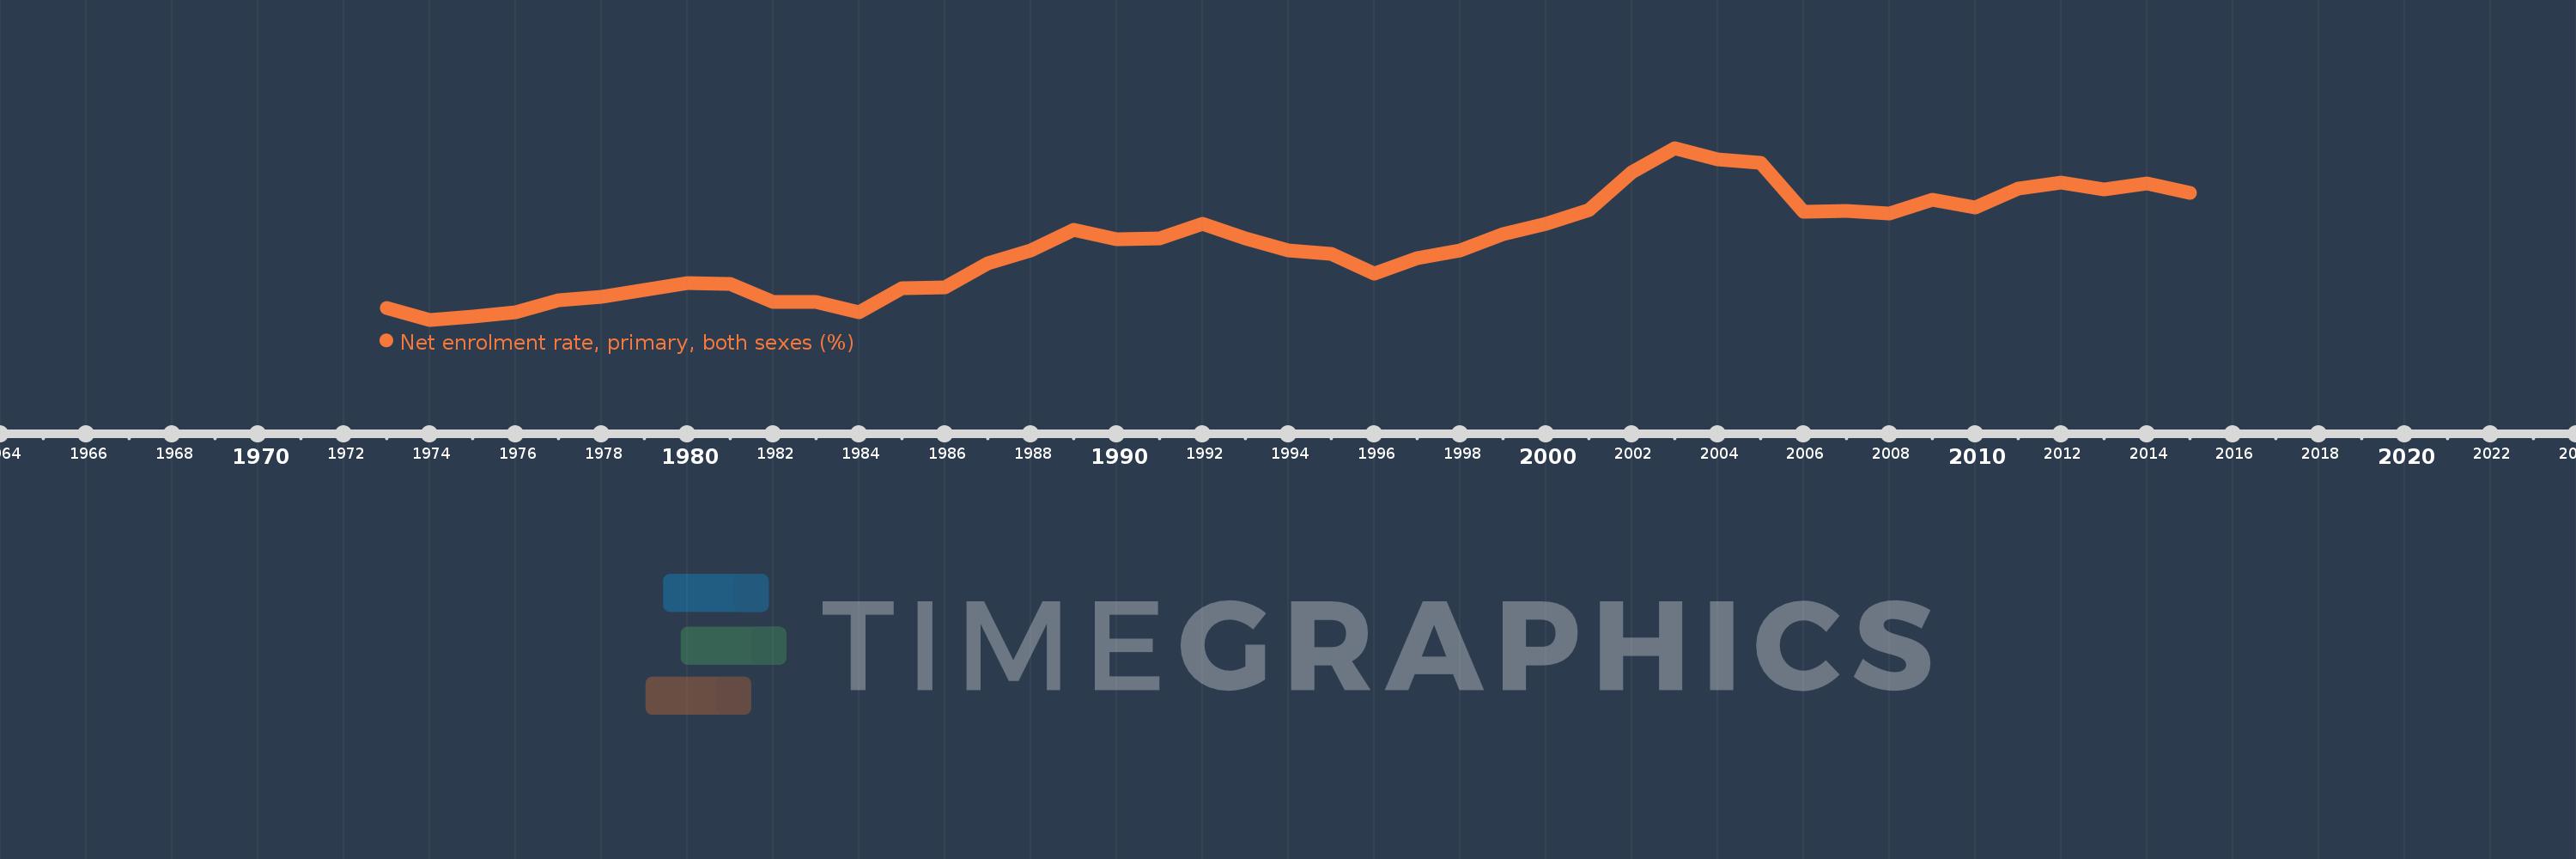
Net enrolment rate, primary, both sexes (%)
2015,2014,2013,2012,2011,2010,2009,2008,2007,2006,2005,2004,2003,2002,2001,2000,1999,1998,1997,1996,1995,1994,1993,1992,1991,1990,1989,1988,1987,1986,1985,1984,1983,1982,1981,1980,1979,1978,1977,1976,1975,1974,1973
This statistics in other country:
AfghanistanAlbaniaAlgeriaAngolaAntigua and BarbudaArab WorldArgentinaArmeniaArubaAustraliaAustriaAzerbaijanBahamas, TheBahrainBangladeshBarbadosBelarusBelgiumBelizeBeninBermudaBhutanBoliviaBosnia and HerzegovinaBotswanaBrazilBrunei DarussalamBulgariaBurkina FasoBurundiCabo VerdeCambodiaCameroonCanadaCaribbean small statesCentral African RepublicCentral Europe and the BalticsChadChileChinaColombiaComorosCongo, Dem. Rep.Congo, Rep.Costa RicaCote d'IvoireCroatiaCubaCyprusDenmarkDjiboutiDominicaDominican RepublicEarly-demographic dividendEast Asia & PacificEast Asia & Pacific (excluding high income)East Asia & Pacific (IDA & IBRD countries)EcuadorEgypt, Arab Rep.El SalvadorEquatorial GuineaEritreaEstoniaEthiopiaEuro areaEurope & Central AsiaEurope & Central Asia (excluding high income)Europe & Central Asia (IDA & IBRD countries)European UnionFijiFinlandFragile and conflict affected situationsFranceGabonGambia, TheGeorgiaGermanyGhanaGreeceGrenadaGuatemalaGuineaGuinea-BissauGuyanaHaitiHeavily indebted poor countries (HIPC)High incomeHondurasHong Kong SAR, ChinaHungaryIBRD onlyIcelandIDA & IBRD totalIDA blendIDA onlyIDA totalIndiaIndonesiaIran, Islamic Rep.IraqIrelandIsraelItalyJamaicaJapanJordanKazakhstanKenyaKiribatiKorea, Dem. People’s Rep.Korea, Rep.KuwaitKyrgyz RepublicLao PDRLate-demographic dividendLatin America & Caribbean Latin America & Caribbean (excluding high income)Latin America & the Caribbean (IDA & IBRD countries)LatviaLeast developed countries: UN classificationLebanonLesothoLiberiaLibyaLiechtensteinLithuaniaLow & middle incomeLow incomeLower middle incomeLuxembourgMacao SAR, ChinaMacedonia, FYRMadagascarMalawiMalaysiaMaldivesMaliMaltaMarshall IslandsMauritaniaMauritiusMexicoMicronesia, Fed. Sts.Middle East & North AfricaMiddle East & North Africa (excluding high income)Middle East & North Africa (IDA & IBRD countries)Middle incomeMoldovaMongoliaMontenegroMoroccoMozambiqueMyanmarNamibiaNauruNepalNetherlandsNew ZealandNicaraguaNigerNigeriaNorth AmericaNorwayOECD membersOmanOther small statesPacific island small statesPakistanPalauPanamaPapua New GuineaParaguayPeruPhilippinesPolandPortugalPost-demographic dividendPre-demographic dividendPuerto RicoQatarRomaniaRussian FederationRwandaSamoaSan MarinoSao Tome and PrincipeSaudi ArabiaSenegalSerbiaSeychellesSierra LeoneSloveniaSmall statesSolomon IslandsSomaliaSouth AfricaSouth AsiaSouth Asia (IDA & IBRD)South SudanSpainSri LankaSt. Kitts and NevisSt. LuciaSt. Vincent and the GrenadinesSub-Saharan Africa Sub-Saharan Africa (excluding high income)Sub-Saharan Africa (IDA & IBRD countries)SudanSurinameSwazilandSwedenSwitzerlandSyrian Arab RepublicTajikistanTanzaniaThailandTimor-LesteTogoTongaTrinidad and TobagoTunisiaTurkeyTuvaluUgandaUkraineUnited Arab EmiratesUnited KingdomUnited StatesUpper middle incomeUruguayUzbekistanVanuatuVenezuela, RBVietnamWest Bank and GazaWorldYemen, Rep.ZambiaZimbabwe Timeline:
This timeline shows a graph from 1973 to 2015 of Europe & Central Asia. No data until 1972. Number of actual observations by date: 43.
Source name:
World Development Indicators
Source organization:
UNESCO Institute for Statistics
Categories, topics:
Education
Last updated:
apr 23, 2017
Indicators value changes by year
Minimum:
92.876
jan 1, 1974
Maximum:
97.028
jan 1, 2003
At the date of observation
Value
Absolute change
Change from previous value
jan 1, 1973
93.158
+93.158
0.0%
jan 1, 1974
92.876
-0.282
-0.3%
jan 1, 1975
92.956
+0.08
0.09%
jan 1, 1976
93.054
+0.098
0.11%
jan 1, 1977
93.348
+0.294
0.32%
jan 1, 1978
93.436
+0.088
0.09%
jan 1, 1979
93.592
+0.156
0.17%
jan 1, 1980
93.771
+0.179
0.19%
jan 1, 1981
93.746
-0.024
-0.03%
jan 1, 1982
93.31
-0.437
-0.47%
jan 1, 1983
93.316
+0.007
0.01%
jan 1, 1984
93.047
-0.269
-0.29%
jan 1, 1985
93.633
+0.586
0.63%
jan 1, 1986
93.656
+0.023
0.02%
jan 1, 1987
94.238
+0.582
0.62%
jan 1, 1988
94.559
+0.321
0.34%
jan 1, 1989
95.052
+0.493
0.52%
jan 1, 1990
94.824
-0.228
-0.24%
jan 1, 1991
94.84
+0.016
0.02%
jan 1, 1992
95.192
+0.353
0.37%
jan 1, 1993
94.841
-0.351
-0.37%
jan 1, 1994
94.556
-0.286
-0.3%
jan 1, 1995
94.459
-0.097
-0.1%
jan 1, 1996
93.992
-0.467
-0.49%
jan 1, 1997
94.357
+0.365
0.39%
jan 1, 1998
94.548
+0.191
0.2%
jan 1, 1999
94.938
+0.39
0.41%
jan 1, 2000
95.194
+0.256
0.27%
jan 1, 2001
95.529
+0.335
0.35%
jan 1, 2002
96.444
+0.915
0.96%
jan 1, 2003
97.028
+0.584
0.61%
jan 1, 2004
96.762
-0.266
-0.27%
jan 1, 2005
96.677
-0.085
-0.09%
jan 1, 2006
95.494
-1.182
-1.22%
jan 1, 2007
95.496
+0.002
0.0%
jan 1, 2008
95.445
-0.051
-0.05%
jan 1, 2009
95.777
+0.332
0.35%
jan 1, 2010
95.592
-0.185
-0.19%
jan 1, 2011
96.05
+0.458
0.48%
jan 1, 2012
96.191
+0.141
0.15%
jan 1, 2013
96.024
-0.166
-0.17%
jan 1, 2014
96.174
+0.15
0.16%
jan 1, 2015
95.933
-0.241
-0.25%
Ranking of countries by current statistics by years


Comments: