29
/
en
AIzaSyAYiBZKx7MnpbEhh9jyipgxe19OcubqV5w
April 1, 2024
25152
Caribbean small states
CSS
false
2
1
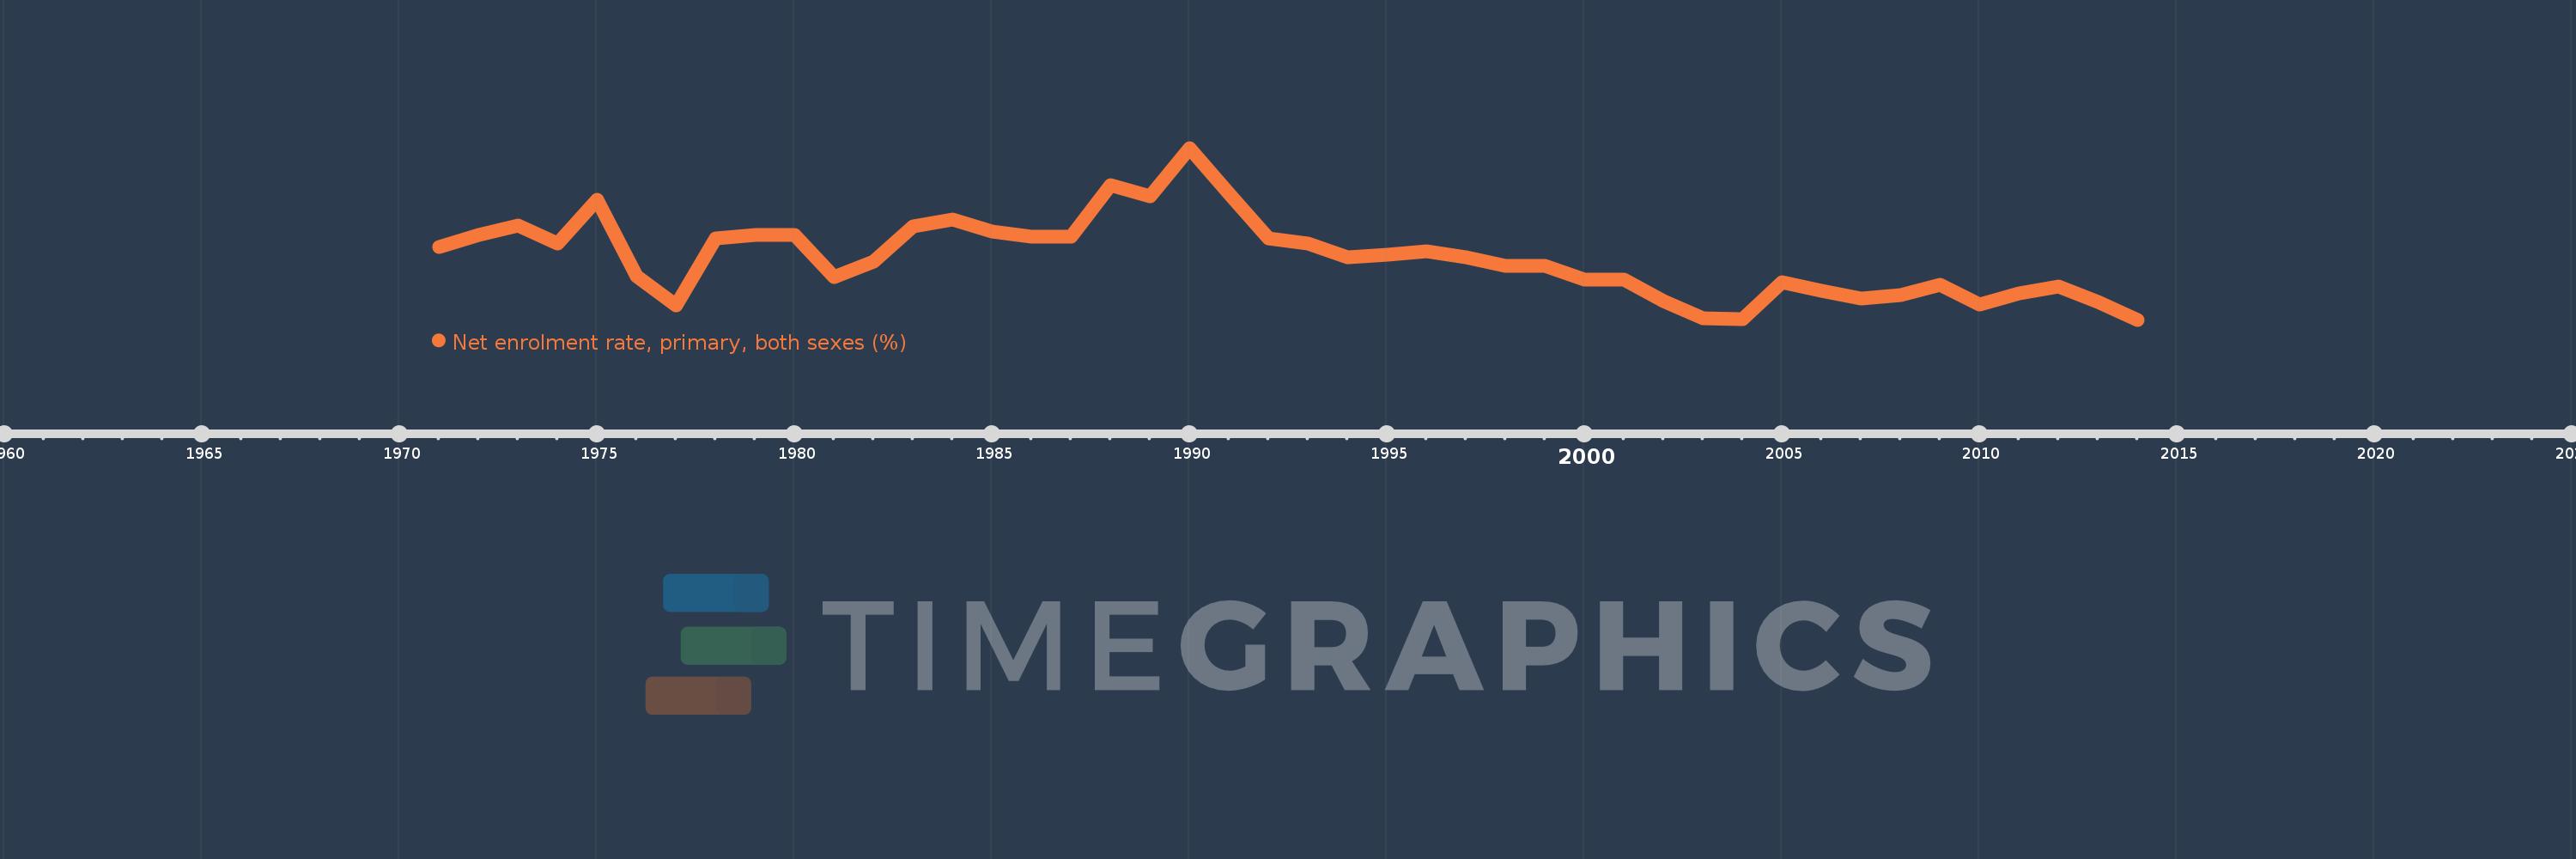
Net enrolment rate, primary, both sexes (%)
2014,2013,2012,2011,2010,2009,2008,2007,2006,2005,2004,2003,2002,2001,2000,1999,1998,1997,1996,1995,1994,1993,1992,1991,1990,1989,1988,1987,1986,1985,1984,1983,1982,1981,1980,1979,1978,1977,1976,1975,1974,1973,1972,1971
This statistics in other country:
AfghanistanAlbaniaAlgeriaAngolaAntigua and BarbudaArab WorldArgentinaArmeniaArubaAustraliaAustriaAzerbaijanBahamas, TheBahrainBangladeshBarbadosBelarusBelgiumBelizeBeninBermudaBhutanBoliviaBosnia and HerzegovinaBotswanaBrazilBrunei DarussalamBulgariaBurkina FasoBurundiCabo VerdeCambodiaCameroonCanadaCaribbean small statesCentral African RepublicCentral Europe and the BalticsChadChileChinaColombiaComorosCongo, Dem. Rep.Congo, Rep.Costa RicaCote d'IvoireCroatiaCubaCyprusDenmarkDjiboutiDominicaDominican RepublicEarly-demographic dividendEast Asia & PacificEast Asia & Pacific (excluding high income)East Asia & Pacific (IDA & IBRD countries)EcuadorEgypt, Arab Rep.El SalvadorEquatorial GuineaEritreaEstoniaEthiopiaEuro areaEurope & Central AsiaEurope & Central Asia (excluding high income)Europe & Central Asia (IDA & IBRD countries)European UnionFijiFinlandFragile and conflict affected situationsFranceGabonGambia, TheGeorgiaGermanyGhanaGreeceGrenadaGuatemalaGuineaGuinea-BissauGuyanaHaitiHeavily indebted poor countries (HIPC)High incomeHondurasHong Kong SAR, ChinaHungaryIBRD onlyIcelandIDA & IBRD totalIDA blendIDA onlyIDA totalIndiaIndonesiaIran, Islamic Rep.IraqIrelandIsraelItalyJamaicaJapanJordanKazakhstanKenyaKiribatiKorea, Dem. People’s Rep.Korea, Rep.KuwaitKyrgyz RepublicLao PDRLate-demographic dividendLatin America & Caribbean Latin America & Caribbean (excluding high income)Latin America & the Caribbean (IDA & IBRD countries)LatviaLeast developed countries: UN classificationLebanonLesothoLiberiaLibyaLiechtensteinLithuaniaLow & middle incomeLow incomeLower middle incomeLuxembourgMacao SAR, ChinaMacedonia, FYRMadagascarMalawiMalaysiaMaldivesMaliMaltaMarshall IslandsMauritaniaMauritiusMexicoMicronesia, Fed. Sts.Middle East & North AfricaMiddle East & North Africa (excluding high income)Middle East & North Africa (IDA & IBRD countries)Middle incomeMoldovaMongoliaMontenegroMoroccoMozambiqueMyanmarNamibiaNauruNepalNetherlandsNew ZealandNicaraguaNigerNigeriaNorth AmericaNorwayOECD membersOmanOther small statesPacific island small statesPakistanPalauPanamaPapua New GuineaParaguayPeruPhilippinesPolandPortugalPost-demographic dividendPre-demographic dividendPuerto RicoQatarRomaniaRussian FederationRwandaSamoaSan MarinoSao Tome and PrincipeSaudi ArabiaSenegalSerbiaSeychellesSierra LeoneSloveniaSmall statesSolomon IslandsSomaliaSouth AfricaSouth AsiaSouth Asia (IDA & IBRD)South SudanSpainSri LankaSt. Kitts and NevisSt. LuciaSt. Vincent and the GrenadinesSub-Saharan Africa Sub-Saharan Africa (excluding high income)Sub-Saharan Africa (IDA & IBRD countries)SudanSurinameSwazilandSwedenSwitzerlandSyrian Arab RepublicTajikistanTanzaniaThailandTimor-LesteTogoTongaTrinidad and TobagoTunisiaTurkeyTuvaluUgandaUkraineUnited Arab EmiratesUnited KingdomUnited StatesUpper middle incomeUruguayUzbekistanVanuatuVenezuela, RBVietnamWest Bank and GazaWorldYemen, Rep.ZambiaZimbabwe Timeline:
This timeline shows a graph from 1971 to 2014 of Caribbean small states. No data until 1970. Number of actual observations by date: 44.
Source name:
World Development Indicators
Source organization:
UNESCO Institute for Statistics
Categories, topics:
Education
Last updated:
apr 23, 2017
Indicators value changes by year
Minimum:
90.887
jan 1, 2014
Maximum:
96.746
jan 1, 1990
At the date of observation
Value
Absolute change
Change from previous value
jan 1, 1971
93.375
+93.375
0.0%
jan 1, 1972
93.776
+0.401
0.43%
jan 1, 1973
94.091
+0.315
0.34%
jan 1, 1974
93.475
-0.616
-0.66%
jan 1, 1975
94.965
+1.491
1.59%
jan 1, 1976
92.374
-2.591
-2.73%
jan 1, 1977
91.362
-1.012
-1.1%
jan 1, 1978
93.651
+2.288
2.5%
jan 1, 1979
93.78
+0.129
0.14%
jan 1, 1980
93.77
-0.01
-0.01%
jan 1, 1981
92.348
-1.421
-1.52%
jan 1, 1982
92.857
+0.509
0.55%
jan 1, 1983
94.064
+1.207
1.3%
jan 1, 1984
94.294
+0.23
0.24%
jan 1, 1985
93.883
-0.411
-0.44%
jan 1, 1986
93.718
-0.166
-0.18%
jan 1, 1987
93.725
+0.007
0.01%
jan 1, 1988
95.47
+1.745
1.86%
jan 1, 1989
95.104
-0.366
-0.38%
jan 1, 1990
96.746
+1.641
1.73%
jan 1, 1991
95.187
-1.559
-1.61%
jan 1, 1992
93.652
-1.536
-1.61%
jan 1, 1993
93.477
-0.175
-0.19%
jan 1, 1994
93.008
-0.469
-0.5%
jan 1, 1995
93.11
+0.102
0.11%
jan 1, 1996
93.211
+0.101
0.11%
jan 1, 1997
93.018
-0.193
-0.21%
jan 1, 1998
92.71
-0.308
-0.33%
jan 1, 1999
92.738
+0.028
0.03%
jan 1, 2000
92.241
-0.496
-0.54%
jan 1, 2001
92.245
+0.004
0.0%
jan 1, 2002
91.513
-0.732
-0.79%
jan 1, 2003
90.937
-0.576
-0.63%
jan 1, 2004
90.907
-0.03
-0.03%
jan 1, 2005
92.17
+1.263
1.39%
jan 1, 2006
91.877
-0.292
-0.32%
jan 1, 2007
91.614
-0.263
-0.29%
jan 1, 2008
91.719
+0.105
0.11%
jan 1, 2009
92.065
+0.346
0.38%
jan 1, 2010
91.396
-0.669
-0.73%
jan 1, 2011
91.801
+0.405
0.44%
jan 1, 2012
92.012
+0.211
0.23%
jan 1, 2013
91.482
-0.53
-0.58%
jan 1, 2014
90.887
-0.595
-0.65%
Ranking of countries by current statistics by years


Comments: