29
/
en
AIzaSyAYiBZKx7MnpbEhh9jyipgxe19OcubqV5w
April 1, 2024
252080
St. Vincent and the Grenadines
VCT
true
2
1
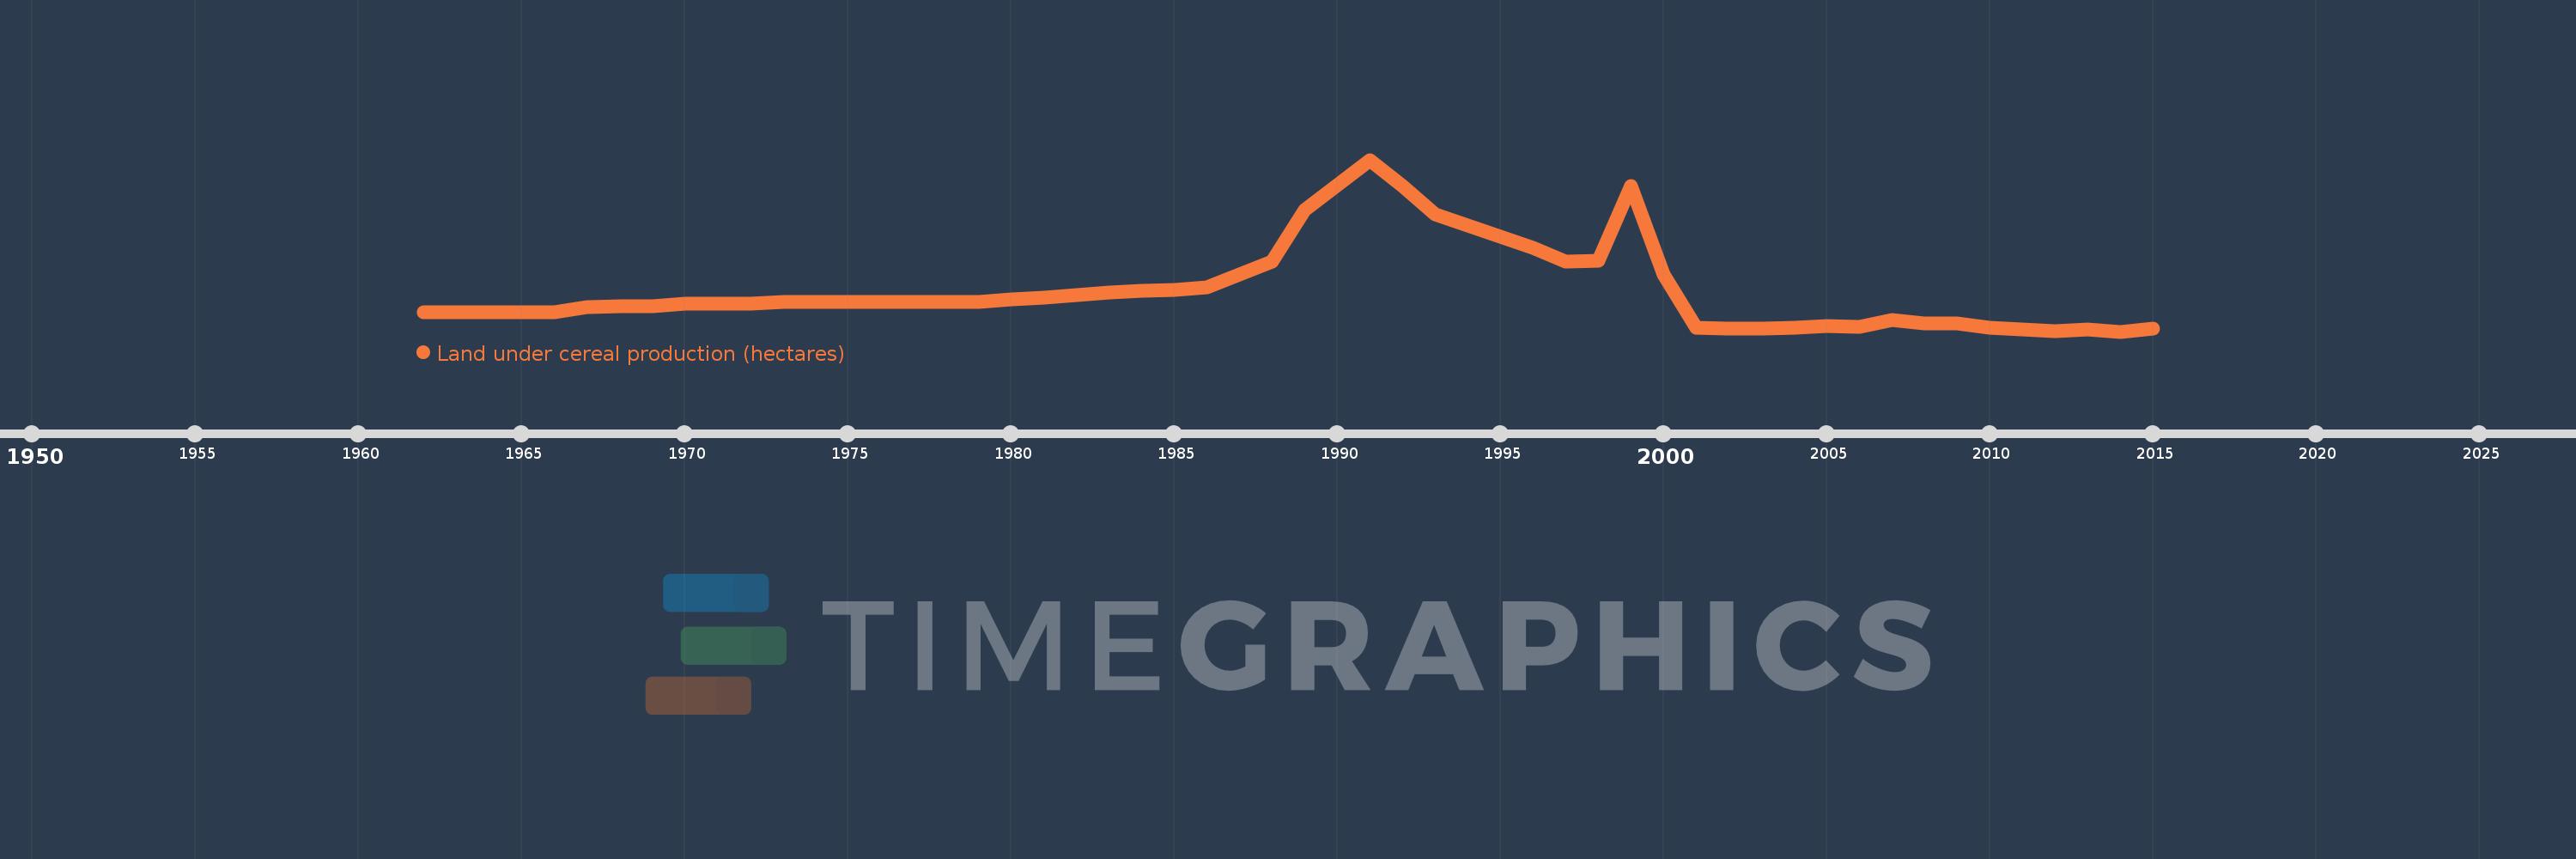
Land under cereal production (hectares)
2015,2014,2013,2012,2011,2010,2009,2008,2007,2006,2005,2004,2003,2002,2001,2000,1999,1998,1997,1996,1995,1994,1993,1992,1991,1990,1989,1988,1987,1986,1985,1984,1983,1982,1981,1980,1979,1978,1977,1976,1975,1974,1973,1972,1971,1970,1969,1968,1967,1966,1965,1964,1963,1962
This statistics in other country:
AfghanistanAlbaniaAlgeriaAngolaAntigua and BarbudaArab WorldArgentinaArmeniaAustraliaAustriaAzerbaijanBahamas, TheBangladeshBarbadosBelarusBelgiumBelizeBeninBhutanBoliviaBosnia and HerzegovinaBotswanaBrazilBrunei DarussalamBulgariaBurkina FasoBurundiCabo VerdeCambodiaCameroonCanadaCaribbean small statesCentral African RepublicCentral Europe and the BalticsChadChileChinaColombiaComorosCongo, Dem. Rep.Congo, Rep.Costa RicaCote d'IvoireCroatiaCubaCyprusCzech RepublicDenmarkDjiboutiDominicaDominican RepublicEarly-demographic dividendEast Asia & PacificEast Asia & Pacific (excluding high income)East Asia & Pacific (IDA & IBRD countries)EcuadorEgypt, Arab Rep.El SalvadorEritreaEstoniaEthiopiaEuro areaEurope & Central AsiaEurope & Central Asia (excluding high income)Europe & Central Asia (IDA & IBRD countries)European UnionFijiFinlandFragile and conflict affected situationsFranceGabonGambia, TheGeorgiaGermanyGhanaGreeceGrenadaGuamGuatemalaGuineaGuinea-BissauGuyanaHaitiHeavily indebted poor countries (HIPC)High incomeHondurasHong Kong SAR, ChinaHungaryIBRD onlyIDA & IBRD totalIDA blendIDA onlyIDA totalIndiaIndonesiaIran, Islamic Rep.IraqIrelandIsraelItalyJamaicaJapanJordanKazakhstanKenyaKorea, Dem. People’s Rep.Korea, Rep.KuwaitKyrgyz RepublicLao PDRLate-demographic dividendLatin America & Caribbean Latin America & Caribbean (excluding high income)Latin America & the Caribbean (IDA & IBRD countries)LatviaLeast developed countries: UN classificationLebanonLesothoLiberiaLibyaLithuaniaLow & middle incomeLow incomeLower middle incomeLuxembourgMacedonia, FYRMadagascarMalawiMalaysiaMaldivesMaliMaltaMauritaniaMauritiusMexicoMicronesia, Fed. Sts.Middle East & North AfricaMiddle East & North Africa (excluding high income)Middle East & North Africa (IDA & IBRD countries)Middle incomeMoldovaMongoliaMontenegroMoroccoMozambiqueMyanmarNamibiaNepalNetherlandsNew CaledoniaNew ZealandNicaraguaNigerNigeriaNorth AmericaNorwayOECD membersOmanOther small statesPacific island small statesPakistanPanamaPapua New GuineaParaguayPeruPhilippinesPolandPortugalPost-demographic dividendPre-demographic dividendPuerto RicoQatarRomaniaRussian FederationRwandaSao Tome and PrincipeSaudi ArabiaSenegalSerbiaSierra LeoneSlovak RepublicSloveniaSmall statesSolomon IslandsSomaliaSouth AfricaSouth AsiaSouth Asia (IDA & IBRD)South SudanSpainSri LankaSt. LuciaSt. Vincent and the GrenadinesSub-Saharan Africa Sub-Saharan Africa (excluding high income)Sub-Saharan Africa (IDA & IBRD countries)SudanSurinameSwazilandSwedenSwitzerlandSyrian Arab RepublicTajikistanTanzaniaThailandTimor-LesteTogoTrinidad and TobagoTunisiaTurkeyTurkmenistanUgandaUkraineUnited Arab EmiratesUnited KingdomUnited StatesUpper middle incomeUruguayUzbekistanVanuatuVenezuela, RBVietnamWest Bank and GazaWorldYemen, Rep.ZambiaZimbabwe Timeline:
This timeline shows a graph from 1962 to 2015 of St. Vincent and the Grenadines. No data until 1961. Number of actual observations by date: 54.
Source name:
World Development Indicators
Source organization:
Food and Agriculture Organization, electronic files and web site.
Categories, topics:
Agriculture & Rural Development
Last updated:
apr 23, 2017
Indicators value changes by year
At the date of observation
Value
Absolute change
Change from previous value
jan 1, 1962
100.0
+100.0
0.0%
jan 1, 1963
100.0
0.0
0.0%
jan 1, 1964
100.0
0.0
0.0%
jan 1, 1965
100.0
0.0
0.0%
jan 1, 1966
100.0
0.0
0.0%
jan 1, 1967
120.0
+20.0
20.0%
jan 1, 1968
125.0
+5.0
4.17%
jan 1, 1969
125.0
0.0
0.0%
jan 1, 1970
135.0
+10.0
8.0%
jan 1, 1971
135.0
0.0
0.0%
jan 1, 1972
135.0
0.0
0.0%
jan 1, 1973
142.0
+7.0
5.19%
jan 1, 1974
140.0
-2.0
-1.41%
jan 1, 1975
140.0
0.0
0.0%
jan 1, 1976
140.0
0.0
0.0%
jan 1, 1977
140.0
0.0
0.0%
jan 1, 1978
140.0
0.0
0.0%
jan 1, 1979
140.0
0.0
0.0%
jan 1, 1980
150.0
+10.0
7.14%
jan 1, 1981
160.0
+10.0
6.67%
jan 1, 1982
170.0
+10.0
6.25%
jan 1, 1983
180.0
+10.0
5.88%
jan 1, 1984
185.0
+5.0
2.78%
jan 1, 1985
190.0
+5.0
2.7%
jan 1, 1986
200.0
+10.0
5.26%
jan 1, 1987
250.0
+50.0
25.0%
jan 1, 1988
300.0
+50.0
20.0%
jan 1, 1989
505.0
+205.0
68.33%
jan 1, 1990
605.0
+100.0
19.8%
jan 1, 1991
704.0
+99.0
16.36%
jan 1, 1992
600.0
-104.0
-14.77%
jan 1, 1993
488.0
-112.0
-18.67%
jan 1, 1994
443.0
-45.0
-9.22%
jan 1, 1995
399.0
-44.0
-9.93%
jan 1, 1996
354.0
-45.0
-11.28%
jan 1, 1997
300.0
-54.0
-15.25%
jan 1, 1998
303.0
+3.0
1.0%
jan 1, 1999
600.0
+297.0
98.02%
jan 1, 2000
250.0
-350.0
-58.33%
jan 1, 2001
40.0
-210.0
-84.0%
jan 1, 2002
35.0
-5.0
-12.5%
jan 1, 2004
40.0
+5.0
14.29%
jan 1, 2005
45.0
+5.0
12.5%
jan 1, 2006
43.0
-2.0
-4.44%
jan 1, 2007
70.0
+27.0
62.79%
jan 1, 2008
55.0
-15.0
-21.43%
jan 1, 2010
40.0
-15.0
-27.27%
jan 1, 2011
31.0
-9.0
-22.5%
jan 1, 2012
25.0
-6.0
-19.35%
jan 1, 2013
33.0
+8.0
32.0%
jan 1, 2014
24.0
-9.0
-27.27%
jan 1, 2015
35.0
+11.0
45.83%
Ranking of countries by current statistics by years


Comments: