29
/
en
AIzaSyAYiBZKx7MnpbEhh9jyipgxe19OcubqV5w
April 1, 2024
208807
New Caledonia
NCL
true
2
1
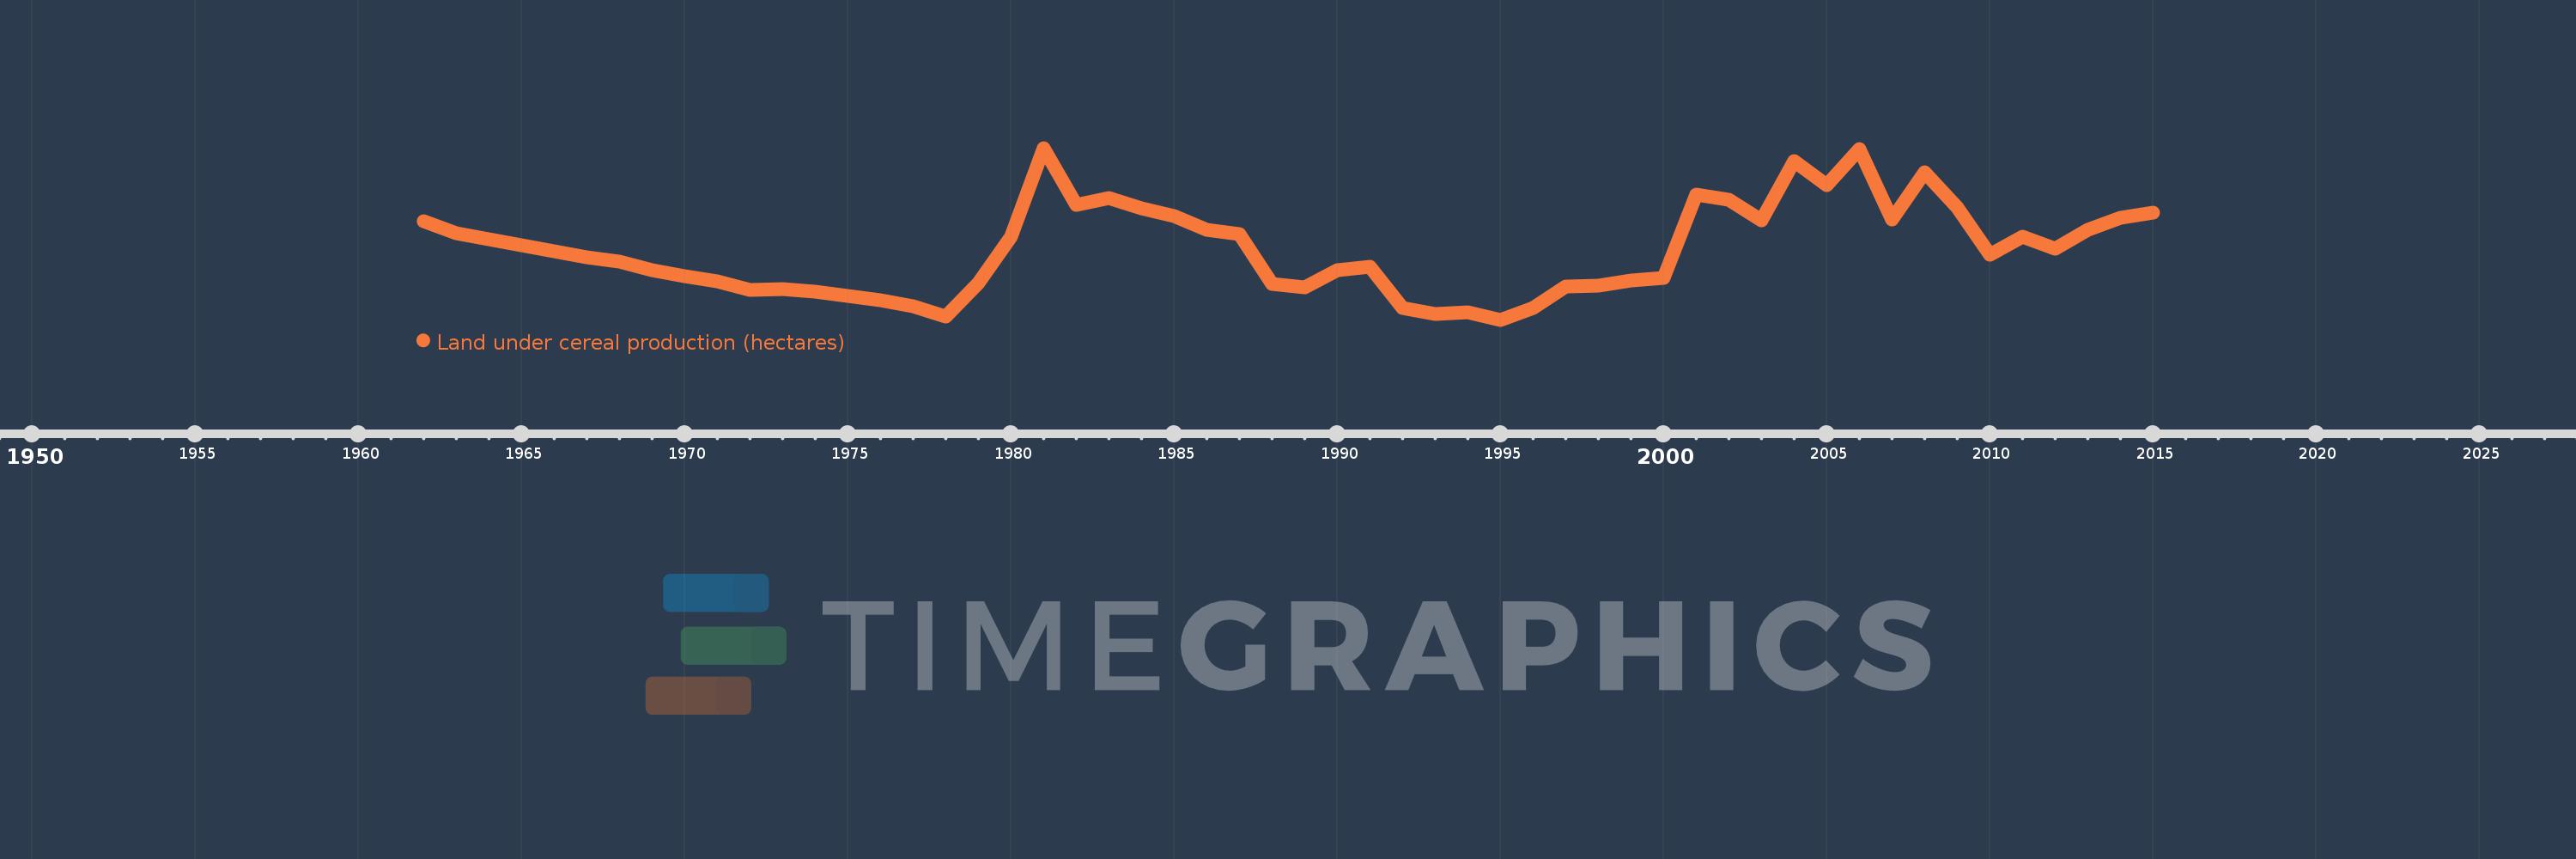
Land under cereal production (hectares)
2015,2014,2013,2012,2011,2010,2009,2008,2007,2006,2005,2004,2003,2002,2001,2000,1999,1998,1997,1996,1995,1994,1993,1992,1991,1990,1989,1988,1987,1986,1985,1984,1983,1982,1981,1980,1979,1978,1977,1976,1975,1974,1973,1972,1971,1970,1969,1968,1967,1966,1965,1964,1963,1962
This statistics in other country:
AfghanistanAlbaniaAlgeriaAngolaAntigua and BarbudaArab WorldArgentinaArmeniaAustraliaAustriaAzerbaijanBahamas, TheBangladeshBarbadosBelarusBelgiumBelizeBeninBhutanBoliviaBosnia and HerzegovinaBotswanaBrazilBrunei DarussalamBulgariaBurkina FasoBurundiCabo VerdeCambodiaCameroonCanadaCaribbean small statesCentral African RepublicCentral Europe and the BalticsChadChileChinaColombiaComorosCongo, Dem. Rep.Congo, Rep.Costa RicaCote d'IvoireCroatiaCubaCyprusCzech RepublicDenmarkDjiboutiDominicaDominican RepublicEarly-demographic dividendEast Asia & PacificEast Asia & Pacific (excluding high income)East Asia & Pacific (IDA & IBRD countries)EcuadorEgypt, Arab Rep.El SalvadorEritreaEstoniaEthiopiaEuro areaEurope & Central AsiaEurope & Central Asia (excluding high income)Europe & Central Asia (IDA & IBRD countries)European UnionFijiFinlandFragile and conflict affected situationsFranceGabonGambia, TheGeorgiaGermanyGhanaGreeceGrenadaGuamGuatemalaGuineaGuinea-BissauGuyanaHaitiHeavily indebted poor countries (HIPC)High incomeHondurasHong Kong SAR, ChinaHungaryIBRD onlyIDA & IBRD totalIDA blendIDA onlyIDA totalIndiaIndonesiaIran, Islamic Rep.IraqIrelandIsraelItalyJamaicaJapanJordanKazakhstanKenyaKorea, Dem. People’s Rep.Korea, Rep.KuwaitKyrgyz RepublicLao PDRLate-demographic dividendLatin America & Caribbean Latin America & Caribbean (excluding high income)Latin America & the Caribbean (IDA & IBRD countries)LatviaLeast developed countries: UN classificationLebanonLesothoLiberiaLibyaLithuaniaLow & middle incomeLow incomeLower middle incomeLuxembourgMacedonia, FYRMadagascarMalawiMalaysiaMaldivesMaliMaltaMauritaniaMauritiusMexicoMicronesia, Fed. Sts.Middle East & North AfricaMiddle East & North Africa (excluding high income)Middle East & North Africa (IDA & IBRD countries)Middle incomeMoldovaMongoliaMontenegroMoroccoMozambiqueMyanmarNamibiaNepalNetherlandsNew CaledoniaNew ZealandNicaraguaNigerNigeriaNorth AmericaNorwayOECD membersOmanOther small statesPacific island small statesPakistanPanamaPapua New GuineaParaguayPeruPhilippinesPolandPortugalPost-demographic dividendPre-demographic dividendPuerto RicoQatarRomaniaRussian FederationRwandaSao Tome and PrincipeSaudi ArabiaSenegalSerbiaSierra LeoneSlovak RepublicSloveniaSmall statesSolomon IslandsSomaliaSouth AfricaSouth AsiaSouth Asia (IDA & IBRD)South SudanSpainSri LankaSt. LuciaSt. Vincent and the GrenadinesSub-Saharan Africa Sub-Saharan Africa (excluding high income)Sub-Saharan Africa (IDA & IBRD countries)SudanSurinameSwazilandSwedenSwitzerlandSyrian Arab RepublicTajikistanTanzaniaThailandTimor-LesteTogoTrinidad and TobagoTunisiaTurkeyTurkmenistanUgandaUkraineUnited Arab EmiratesUnited KingdomUnited StatesUpper middle incomeUruguayUzbekistanVanuatuVenezuela, RBVietnamWest Bank and GazaWorldYemen, Rep.ZambiaZimbabwe Timeline:
This timeline shows a graph from 1962 to 2015 of New Caledonia. No data until 1961. Number of actual observations by date: 54.
Source name:
World Development Indicators
Source organization:
Food and Agriculture Organization, electronic files and web site.
Categories, topics:
Agriculture & Rural Development
Last updated:
apr 23, 2017
Indicators value changes by year
Maximum:
1.671K
jan 1, 1981
At the date of observation
Value
Absolute change
Change from previous value
jan 1, 1962
1.05K
+1.05K
0.0%
jan 1, 1963
950.0
-100.0
-9.52%
jan 1, 1964
900.0
-50.0
-5.26%
jan 1, 1965
850.0
-50.0
-5.56%
jan 1, 1966
800.0
-50.0
-5.88%
jan 1, 1967
750.0
-50.0
-6.25%
jan 1, 1968
710.0
-40.0
-5.33%
jan 1, 1969
642.0
-68.0
-9.58%
jan 1, 1970
590.0
-52.0
-8.1%
jan 1, 1971
545.0
-45.0
-7.63%
jan 1, 1972
475.0
-70.0
-12.84%
jan 1, 1973
480.0
+5.0
1.05%
jan 1, 1974
460.0
-20.0
-4.17%
jan 1, 1975
420.0
-40.0
-8.7%
jan 1, 1976
388.0
-32.0
-7.62%
jan 1, 1977
335.0
-53.0
-13.66%
jan 1, 1978
246.0
-89.0
-26.57%
jan 1, 1979
527.0
+281.0
114.23%
jan 1, 1980
918.0
+391.0
74.19%
jan 1, 1981
1.671K
+753.0
82.03%
jan 1, 1982
1.191K
-480.0
-28.73%
jan 1, 1983
1.251K
+60.0
5.04%
jan 1, 1984
1.162K
-89.0
-7.11%
jan 1, 1985
1.095K
-67.0
-5.77%
jan 1, 1986
979.0
-116.0
-10.59%
jan 1, 1987
941.0
-38.0
-3.88%
jan 1, 1988
519.0
-422.0
-44.85%
jan 1, 1989
490.0
-29.0
-5.59%
jan 1, 1990
640.0
+150.0
30.61%
jan 1, 1991
667.0
+27.0
4.22%
jan 1, 1992
320.0
-347.0
-52.02%
jan 1, 1993
269.0
-51.0
-15.94%
jan 1, 1994
285.0
+16.0
5.95%
jan 1, 1995
220.0
-65.0
-22.81%
jan 1, 1996
320.0
+100.0
45.45%
jan 1, 1997
502.0
+182.0
56.88%
jan 1, 1998
507.0
+5.0
1.0%
jan 1, 1999
549.0
+42.0
8.28%
jan 1, 2000
575.0
+26.0
4.74%
jan 1, 2001
1.275K
+700.0
121.74%
jan 1, 2002
1.233K
-42.0
-3.29%
jan 1, 2003
1.062K
-171.0
-13.87%
jan 1, 2004
1.563K
+501.0
47.18%
jan 1, 2005
1.358K
-205.0
-13.12%
jan 1, 2006
1.664K
+306.0
22.53%
jan 1, 2007
1.066K
-598.0
-35.94%
jan 1, 2008
1.469K
+403.0
37.8%
jan 1, 2009
1.167K
-302.0
-20.56%
jan 1, 2010
767.0
-400.0
-34.28%
jan 1, 2011
918.0
+151.0
19.69%
jan 1, 2012
821.0
-97.0
-10.57%
jan 1, 2013
980.0
+159.0
19.37%
jan 1, 2014
1.08K
+100.0
10.2%
jan 1, 2015
1.124K
+44.0
4.07%
Ranking of countries by current statistics by years


Comments: