29
/
en
AIzaSyAYiBZKx7MnpbEhh9jyipgxe19OcubqV5w
April 1, 2024
190458
Mali
MLI
true
2
1
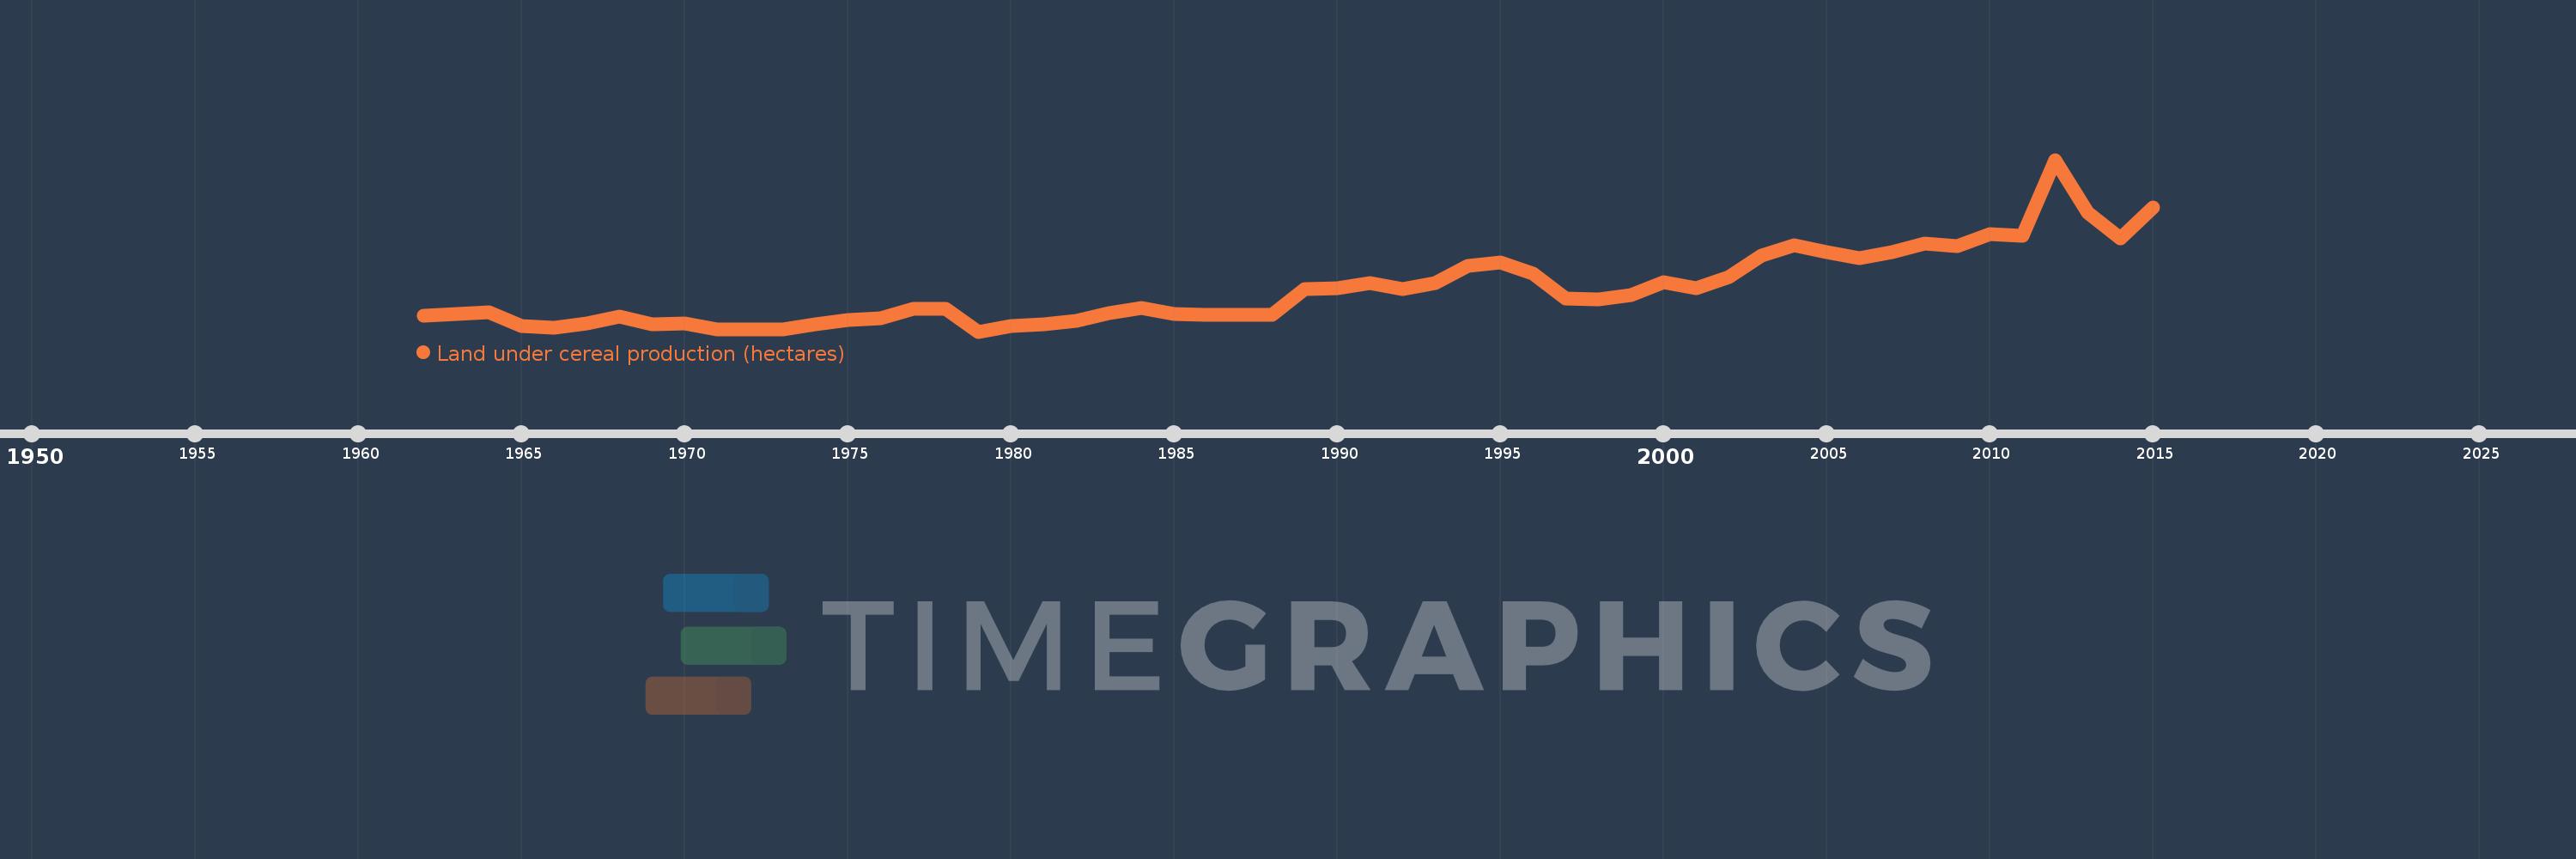
Land under cereal production (hectares)
2015,2014,2013,2012,2011,2010,2009,2008,2007,2006,2005,2004,2003,2002,2001,2000,1999,1998,1997,1996,1995,1994,1993,1992,1991,1990,1989,1988,1987,1986,1985,1984,1983,1982,1981,1980,1979,1978,1977,1976,1975,1974,1973,1972,1971,1970,1969,1968,1967,1966,1965,1964,1963,1962
This statistics in other country:
AfghanistanAlbaniaAlgeriaAngolaAntigua and BarbudaArab WorldArgentinaArmeniaAustraliaAustriaAzerbaijanBahamas, TheBangladeshBarbadosBelarusBelgiumBelizeBeninBhutanBoliviaBosnia and HerzegovinaBotswanaBrazilBrunei DarussalamBulgariaBurkina FasoBurundiCabo VerdeCambodiaCameroonCanadaCaribbean small statesCentral African RepublicCentral Europe and the BalticsChadChileChinaColombiaComorosCongo, Dem. Rep.Congo, Rep.Costa RicaCote d'IvoireCroatiaCubaCyprusCzech RepublicDenmarkDjiboutiDominicaDominican RepublicEarly-demographic dividendEast Asia & PacificEast Asia & Pacific (excluding high income)East Asia & Pacific (IDA & IBRD countries)EcuadorEgypt, Arab Rep.El SalvadorEritreaEstoniaEthiopiaEuro areaEurope & Central AsiaEurope & Central Asia (excluding high income)Europe & Central Asia (IDA & IBRD countries)European UnionFijiFinlandFragile and conflict affected situationsFranceGabonGambia, TheGeorgiaGermanyGhanaGreeceGrenadaGuamGuatemalaGuineaGuinea-BissauGuyanaHaitiHeavily indebted poor countries (HIPC)High incomeHondurasHong Kong SAR, ChinaHungaryIBRD onlyIDA & IBRD totalIDA blendIDA onlyIDA totalIndiaIndonesiaIran, Islamic Rep.IraqIrelandIsraelItalyJamaicaJapanJordanKazakhstanKenyaKorea, Dem. People’s Rep.Korea, Rep.KuwaitKyrgyz RepublicLao PDRLate-demographic dividendLatin America & Caribbean Latin America & Caribbean (excluding high income)Latin America & the Caribbean (IDA & IBRD countries)LatviaLeast developed countries: UN classificationLebanonLesothoLiberiaLibyaLithuaniaLow & middle incomeLow incomeLower middle incomeLuxembourgMacedonia, FYRMadagascarMalawiMalaysiaMaldivesMaliMaltaMauritaniaMauritiusMexicoMicronesia, Fed. Sts.Middle East & North AfricaMiddle East & North Africa (excluding high income)Middle East & North Africa (IDA & IBRD countries)Middle incomeMoldovaMongoliaMontenegroMoroccoMozambiqueMyanmarNamibiaNepalNetherlandsNew CaledoniaNew ZealandNicaraguaNigerNigeriaNorth AmericaNorwayOECD membersOmanOther small statesPacific island small statesPakistanPanamaPapua New GuineaParaguayPeruPhilippinesPolandPortugalPost-demographic dividendPre-demographic dividendPuerto RicoQatarRomaniaRussian FederationRwandaSao Tome and PrincipeSaudi ArabiaSenegalSerbiaSierra LeoneSlovak RepublicSloveniaSmall statesSolomon IslandsSomaliaSouth AfricaSouth AsiaSouth Asia (IDA & IBRD)South SudanSpainSri LankaSt. LuciaSt. Vincent and the GrenadinesSub-Saharan Africa Sub-Saharan Africa (excluding high income)Sub-Saharan Africa (IDA & IBRD countries)SudanSurinameSwazilandSwedenSwitzerlandSyrian Arab RepublicTajikistanTanzaniaThailandTimor-LesteTogoTrinidad and TobagoTunisiaTurkeyTurkmenistanUgandaUkraineUnited Arab EmiratesUnited KingdomUnited StatesUpper middle incomeUruguayUzbekistanVanuatuVenezuela, RBVietnamWest Bank and GazaWorldYemen, Rep.ZambiaZimbabwe Timeline:
This timeline shows a graph from 1962 to 2015 of Mali. No data until 1961. Number of actual observations by date: 54.
Source name:
World Development Indicators
Source organization:
Food and Agriculture Organization, electronic files and web site.
Categories, topics:
Agriculture & Rural Development
Last updated:
apr 23, 2017
Indicators value changes by year
Minimum:
1.125 mln
jan 1, 1979
Maximum:
5.8 mln
jan 1, 2012
At the date of observation
Value
Absolute change
Change from previous value
jan 1, 1962
1.564 mln
+1.564 mln
0.0%
jan 1, 1963
1.601 mln
+37.495K
2.4%
jan 1, 1964
1.641 mln
+39.559K
2.47%
jan 1, 1965
1.266 mln
-375.074K
-22.86%
jan 1, 1966
1.221 mln
-44.535K
-3.52%
jan 1, 1967
1.338 mln
+116.105K
9.51%
jan 1, 1968
1.542 mln
+204.745K
15.31%
jan 1, 1969
1.322 mln
-220.11K
-14.27%
jan 1, 1970
1.351 mln
+28.55K
2.16%
jan 1, 1971
1.195 mln
-155.84K
-11.54%
jan 1, 1972
1.183 mln
-11.6K
-0.97%
jan 1, 1973
1.188 mln
+4.4K
0.37%
jan 1, 1974
1.322 mln
+133.9K
11.27%
jan 1, 1975
1.449 mln
+127.8K
9.67%
jan 1, 1976
1.484 mln
+34.472K
2.38%
jan 1, 1977
1.743 mln
+259.028K
17.46%
jan 1, 1978
1.746 mln
+3.0K
0.17%
jan 1, 1979
1.125 mln
-620.625K
-35.55%
jan 1, 1980
1.275 mln
+150.159K
13.34%
jan 1, 1981
1.333 mln
+57.541K
4.51%
jan 1, 1982
1.429 mln
+95.618K
7.17%
jan 1, 1983
1.633 mln
+204.131K
14.29%
jan 1, 1984
1.763 mln
+130.226K
7.98%
jan 1, 1985
1.598 mln
-164.575K
-9.34%
jan 1, 1986
1.591 mln
-7.068K
-0.44%
jan 1, 1987
1.585 mln
-5.891K
-0.37%
jan 1, 1988
1.587 mln
+1.238K
0.08%
jan 1, 1989
2.283 mln
+696.546K
43.9%
jan 1, 1990
2.295 mln
+11.839K
0.52%
jan 1, 1991
2.439 mln
+143.656K
6.26%
jan 1, 1992
2.288 mln
-151.031K
-6.19%
jan 1, 1993
2.452 mln
+163.933K
7.17%
jan 1, 1994
2.921 mln
+469.41K
19.15%
jan 1, 1995
3.005 mln
+84.049K
2.88%
jan 1, 1996
2.702 mln
-303.082K
-10.09%
jan 1, 1997
2.017 mln
-685.449K
-25.37%
jan 1, 1998
2.008 mln
-8.057K
-0.4%
jan 1, 1999
2.116 mln
+107.482K
5.35%
jan 1, 2000
2.465 mln
+348.692K
16.48%
jan 1, 2001
2.295 mln
-169.426K
-6.87%
jan 1, 2002
2.62 mln
+324.836K
14.15%
jan 1, 2003
3.195 mln
+575.382K
21.96%
jan 1, 2004
3.474 mln
+278.686K
8.72%
jan 1, 2005
3.292 mln
-181.778K
-5.23%
jan 1, 2006
3.119 mln
-172.877K
-5.25%
jan 1, 2007
3.284 mln
+164.068K
5.26%
jan 1, 2008
3.529 mln
+245.001K
7.46%
jan 1, 2009
3.445 mln
-83.506K
-2.37%
jan 1, 2010
3.782 mln
+336.965K
9.78%
jan 1, 2011
3.735 mln
-46.906K
-1.24%
jan 1, 2012
5.8 mln
+2.065 mln
55.28%
jan 1, 2013
4.37 mln
-1.43 mln
-24.65%
jan 1, 2014
3.662 mln
-708.052K
-16.2%
jan 1, 2015
4.502 mln
+839.912K
22.94%
Ranking of countries by current statistics by years


Comments: