29
/
en
AIzaSyAYiBZKx7MnpbEhh9jyipgxe19OcubqV5w
April 1, 2024
52006
North America
NAC
false
2
1
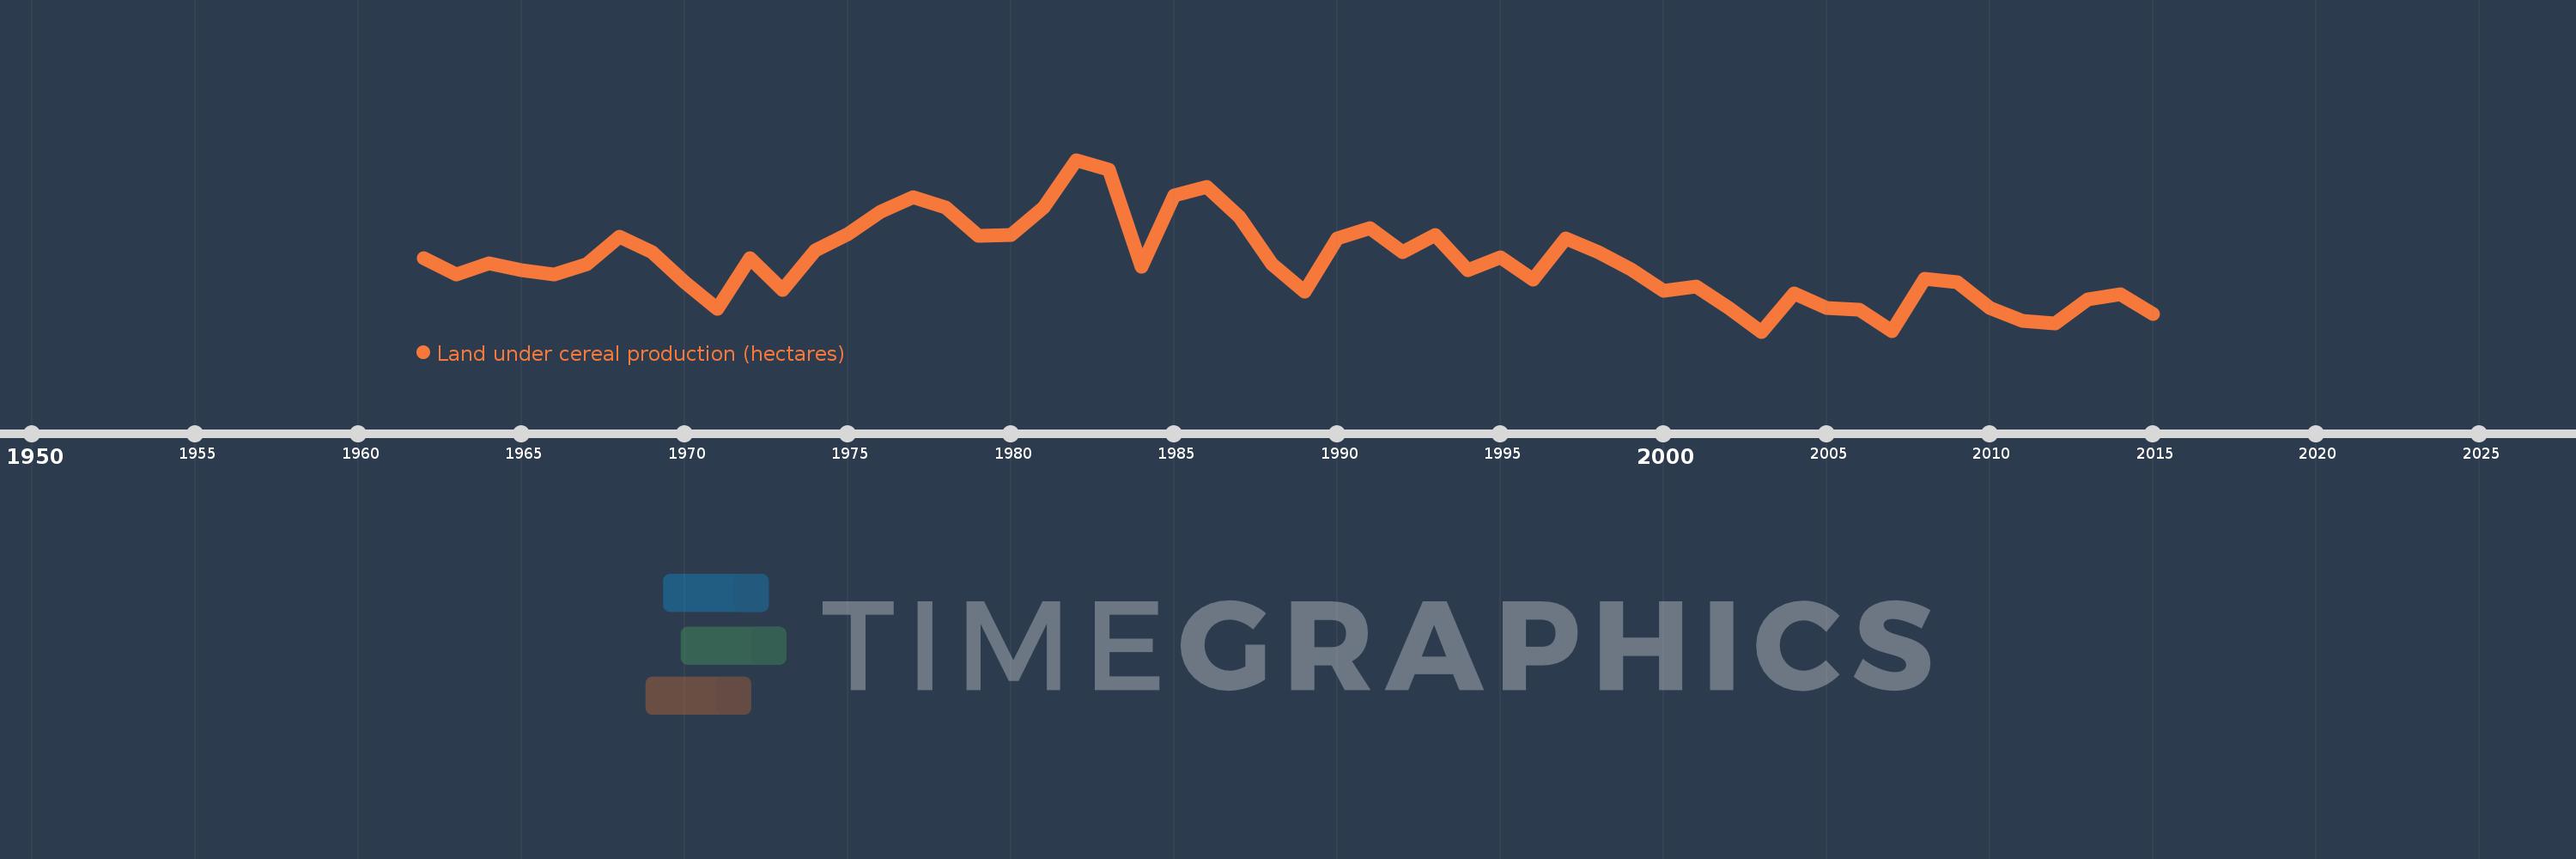
Land under cereal production (hectares)
2015,2014,2013,2012,2011,2010,2009,2008,2007,2006,2005,2004,2003,2002,2001,2000,1999,1998,1997,1996,1995,1994,1993,1992,1991,1990,1989,1988,1987,1986,1985,1984,1983,1982,1981,1980,1979,1978,1977,1976,1975,1974,1973,1972,1971,1970,1969,1968,1967,1966,1965,1964,1963,1962
This statistics in other country:
AfghanistanAlbaniaAlgeriaAngolaAntigua and BarbudaArab WorldArgentinaArmeniaAustraliaAustriaAzerbaijanBahamas, TheBangladeshBarbadosBelarusBelgiumBelizeBeninBhutanBoliviaBosnia and HerzegovinaBotswanaBrazilBrunei DarussalamBulgariaBurkina FasoBurundiCabo VerdeCambodiaCameroonCanadaCaribbean small statesCentral African RepublicCentral Europe and the BalticsChadChileChinaColombiaComorosCongo, Dem. Rep.Congo, Rep.Costa RicaCote d'IvoireCroatiaCubaCyprusCzech RepublicDenmarkDjiboutiDominicaDominican RepublicEarly-demographic dividendEast Asia & PacificEast Asia & Pacific (excluding high income)East Asia & Pacific (IDA & IBRD countries)EcuadorEgypt, Arab Rep.El SalvadorEritreaEstoniaEthiopiaEuro areaEurope & Central AsiaEurope & Central Asia (excluding high income)Europe & Central Asia (IDA & IBRD countries)European UnionFijiFinlandFragile and conflict affected situationsFranceGabonGambia, TheGeorgiaGermanyGhanaGreeceGrenadaGuamGuatemalaGuineaGuinea-BissauGuyanaHaitiHeavily indebted poor countries (HIPC)High incomeHondurasHong Kong SAR, ChinaHungaryIBRD onlyIDA & IBRD totalIDA blendIDA onlyIDA totalIndiaIndonesiaIran, Islamic Rep.IraqIrelandIsraelItalyJamaicaJapanJordanKazakhstanKenyaKorea, Dem. People’s Rep.Korea, Rep.KuwaitKyrgyz RepublicLao PDRLate-demographic dividendLatin America & Caribbean Latin America & Caribbean (excluding high income)Latin America & the Caribbean (IDA & IBRD countries)LatviaLeast developed countries: UN classificationLebanonLesothoLiberiaLibyaLithuaniaLow & middle incomeLow incomeLower middle incomeLuxembourgMacedonia, FYRMadagascarMalawiMalaysiaMaldivesMaliMaltaMauritaniaMauritiusMexicoMicronesia, Fed. Sts.Middle East & North AfricaMiddle East & North Africa (excluding high income)Middle East & North Africa (IDA & IBRD countries)Middle incomeMoldovaMongoliaMontenegroMoroccoMozambiqueMyanmarNamibiaNepalNetherlandsNew CaledoniaNew ZealandNicaraguaNigerNigeriaNorth AmericaNorwayOECD membersOmanOther small statesPacific island small statesPakistanPanamaPapua New GuineaParaguayPeruPhilippinesPolandPortugalPost-demographic dividendPre-demographic dividendPuerto RicoQatarRomaniaRussian FederationRwandaSao Tome and PrincipeSaudi ArabiaSenegalSerbiaSierra LeoneSlovak RepublicSloveniaSmall statesSolomon IslandsSomaliaSouth AfricaSouth AsiaSouth Asia (IDA & IBRD)South SudanSpainSri LankaSt. LuciaSt. Vincent and the GrenadinesSub-Saharan Africa Sub-Saharan Africa (excluding high income)Sub-Saharan Africa (IDA & IBRD countries)SudanSurinameSwazilandSwedenSwitzerlandSyrian Arab RepublicTajikistanTanzaniaThailandTimor-LesteTogoTrinidad and TobagoTunisiaTurkeyTurkmenistanUgandaUkraineUnited Arab EmiratesUnited KingdomUnited StatesUpper middle incomeUruguayUzbekistanVanuatuVenezuela, RBVietnamWest Bank and GazaWorldYemen, Rep.ZambiaZimbabwe Timeline:
This timeline shows a graph from 1962 to 2015 of North America. No data until 1961. Number of actual observations by date: 54.
Source name:
World Development Indicators
Source organization:
Food and Agriculture Organization, electronic files and web site.
Categories, topics:
Agriculture & Rural Development
Last updated:
apr 23, 2017
Indicators value changes by year
Minimum:
68.747 mln
jan 1, 2003
Maximum:
99.41 mln
jan 1, 1982
At the date of observation
Value
Absolute change
Change from previous value
jan 1, 1962
81.855 mln
+81.855 mln
0.0%
jan 1, 1963
78.889 mln
-2.966 mln
-3.62%
jan 1, 1964
80.976 mln
+2.088 mln
2.65%
jan 1, 1965
79.642 mln
-1.335 mln
-1.65%
jan 1, 1966
79.004 mln
-637.396K
-0.8%
jan 1, 1967
80.741 mln
+1.737 mln
2.2%
jan 1, 1968
85.651 mln
+4.91 mln
6.08%
jan 1, 1969
82.883 mln
-2.768 mln
-3.23%
jan 1, 1970
77.594 mln
-5.289 mln
-6.38%
jan 1, 1971
72.76 mln
-4.833 mln
-6.23%
jan 1, 1972
81.897 mln
+9.137 mln
12.56%
jan 1, 1973
76.212 mln
-5.684 mln
-6.94%
jan 1, 1974
83.289 mln
+7.076 mln
9.29%
jan 1, 1975
86.137 mln
+2.848 mln
3.42%
jan 1, 1976
90.102 mln
+3.966 mln
4.6%
jan 1, 1977
92.729 mln
+2.627 mln
2.92%
jan 1, 1978
90.864 mln
-1.864 mln
-2.01%
jan 1, 1979
85.781 mln
-5.083 mln
-5.59%
jan 1, 1980
86.06 mln
+278.58K
0.32%
jan 1, 1981
90.869 mln
+4.81 mln
5.59%
jan 1, 1982
99.41 mln
+8.541 mln
9.4%
jan 1, 1983
97.695 mln
-1.715 mln
-1.72%
jan 1, 1984
80.251 mln
-17.444 mln
-17.86%
jan 1, 1985
93.059 mln
+12.808 mln
15.96%
jan 1, 1986
94.582 mln
+1.524 mln
1.64%
jan 1, 1987
89.27 mln
-5.313 mln
-5.62%
jan 1, 1988
80.778 mln
-8.491 mln
-9.51%
jan 1, 1989
75.946 mln
-4.832 mln
-5.98%
jan 1, 1990
85.455 mln
+9.509 mln
12.52%
jan 1, 1991
87.248 mln
+1.792 mln
2.1%
jan 1, 1992
82.994 mln
-4.254 mln
-4.88%
jan 1, 1993
86.062 mln
+3.068 mln
3.7%
jan 1, 1994
79.718 mln
-6.344 mln
-7.37%
jan 1, 1995
81.979 mln
+2.262 mln
2.84%
jan 1, 1996
78.043 mln
-3.937 mln
-4.8%
jan 1, 1997
85.446 mln
+7.403 mln
9.49%
jan 1, 1998
82.979 mln
-2.467 mln
-2.89%
jan 1, 1999
79.887 mln
-3.091 mln
-3.73%
jan 1, 2000
76.044 mln
-3.843 mln
-4.81%
jan 1, 2001
76.736 mln
+691.605K
0.91%
jan 1, 2002
72.904 mln
-3.832 mln
-4.99%
jan 1, 2003
68.747 mln
-4.156 mln
-5.7%
jan 1, 2004
75.64 mln
+6.893 mln
10.03%
jan 1, 2005
72.947 mln
-2.693 mln
-3.56%
jan 1, 2006
72.656 mln
-291.033K
-0.4%
jan 1, 2007
68.809 mln
-3.847 mln
-5.29%
jan 1, 2008
78.145 mln
+9.336 mln
13.57%
jan 1, 2009
77.499 mln
-645.473K
-0.83%
jan 1, 2010
72.984 mln
-4.515 mln
-5.83%
jan 1, 2011
70.629 mln
-2.355 mln
-3.23%
jan 1, 2012
70.16 mln
-468.648K
-0.66%
jan 1, 2013
74.53 mln
+4.369 mln
6.23%
jan 1, 2014
75.403 mln
+873.431K
1.17%
jan 1, 2015
71.96 mln
-3.443 mln
-4.57%
Ranking of countries by current statistics by years


Comments: