29
/
en
AIzaSyAYiBZKx7MnpbEhh9jyipgxe19OcubqV5w
April 1, 2024
171889
Kuwait
KWT
true
2
1
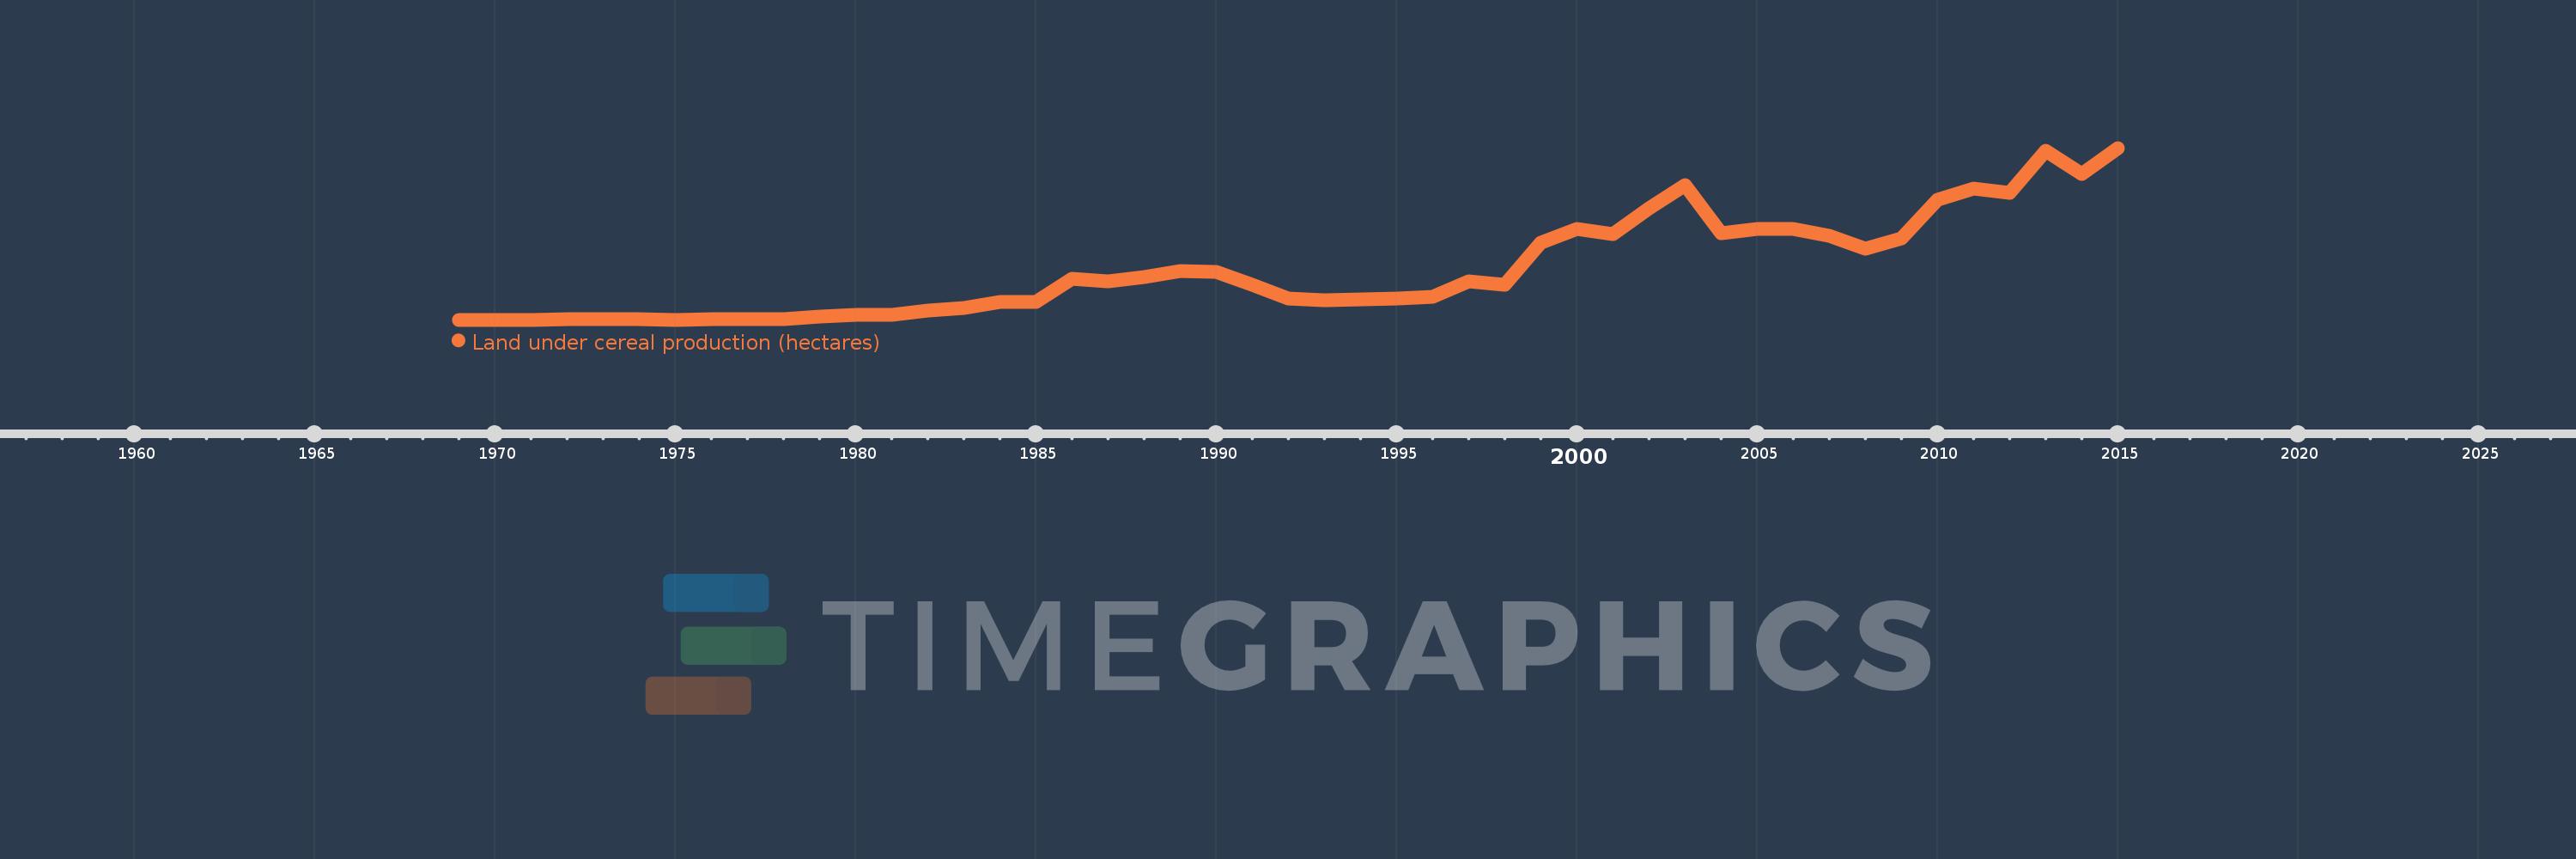
Land under cereal production (hectares)
2015,2014,2013,2012,2011,2010,2009,2008,2007,2006,2005,2004,2003,2002,2001,2000,1999,1998,1997,1996,1995,1994,1993,1992,1991,1990,1989,1988,1987,1986,1985,1984,1983,1982,1981,1980,1979,1978,1977,1976,1975,1974,1973,1972,1971,1970,1969
This statistics in other country:
AfghanistanAlbaniaAlgeriaAngolaAntigua and BarbudaArab WorldArgentinaArmeniaAustraliaAustriaAzerbaijanBahamas, TheBangladeshBarbadosBelarusBelgiumBelizeBeninBhutanBoliviaBosnia and HerzegovinaBotswanaBrazilBrunei DarussalamBulgariaBurkina FasoBurundiCabo VerdeCambodiaCameroonCanadaCaribbean small statesCentral African RepublicCentral Europe and the BalticsChadChileChinaColombiaComorosCongo, Dem. Rep.Congo, Rep.Costa RicaCote d'IvoireCroatiaCubaCyprusCzech RepublicDenmarkDjiboutiDominicaDominican RepublicEarly-demographic dividendEast Asia & PacificEast Asia & Pacific (excluding high income)East Asia & Pacific (IDA & IBRD countries)EcuadorEgypt, Arab Rep.El SalvadorEritreaEstoniaEthiopiaEuro areaEurope & Central AsiaEurope & Central Asia (excluding high income)Europe & Central Asia (IDA & IBRD countries)European UnionFijiFinlandFragile and conflict affected situationsFranceGabonGambia, TheGeorgiaGermanyGhanaGreeceGrenadaGuamGuatemalaGuineaGuinea-BissauGuyanaHaitiHeavily indebted poor countries (HIPC)High incomeHondurasHong Kong SAR, ChinaHungaryIBRD onlyIDA & IBRD totalIDA blendIDA onlyIDA totalIndiaIndonesiaIran, Islamic Rep.IraqIrelandIsraelItalyJamaicaJapanJordanKazakhstanKenyaKorea, Dem. People’s Rep.Korea, Rep.KuwaitKyrgyz RepublicLao PDRLate-demographic dividendLatin America & Caribbean Latin America & Caribbean (excluding high income)Latin America & the Caribbean (IDA & IBRD countries)LatviaLeast developed countries: UN classificationLebanonLesothoLiberiaLibyaLithuaniaLow & middle incomeLow incomeLower middle incomeLuxembourgMacedonia, FYRMadagascarMalawiMalaysiaMaldivesMaliMaltaMauritaniaMauritiusMexicoMicronesia, Fed. Sts.Middle East & North AfricaMiddle East & North Africa (excluding high income)Middle East & North Africa (IDA & IBRD countries)Middle incomeMoldovaMongoliaMontenegroMoroccoMozambiqueMyanmarNamibiaNepalNetherlandsNew CaledoniaNew ZealandNicaraguaNigerNigeriaNorth AmericaNorwayOECD membersOmanOther small statesPacific island small statesPakistanPanamaPapua New GuineaParaguayPeruPhilippinesPolandPortugalPost-demographic dividendPre-demographic dividendPuerto RicoQatarRomaniaRussian FederationRwandaSao Tome and PrincipeSaudi ArabiaSenegalSerbiaSierra LeoneSlovak RepublicSloveniaSmall statesSolomon IslandsSomaliaSouth AfricaSouth AsiaSouth Asia (IDA & IBRD)South SudanSpainSri LankaSt. LuciaSt. Vincent and the GrenadinesSub-Saharan Africa Sub-Saharan Africa (excluding high income)Sub-Saharan Africa (IDA & IBRD countries)SudanSurinameSwazilandSwedenSwitzerlandSyrian Arab RepublicTajikistanTanzaniaThailandTimor-LesteTogoTrinidad and TobagoTunisiaTurkeyTurkmenistanUgandaUkraineUnited Arab EmiratesUnited KingdomUnited StatesUpper middle incomeUruguayUzbekistanVanuatuVenezuela, RBVietnamWest Bank and GazaWorldYemen, Rep.ZambiaZimbabwe Timeline:
This timeline shows a graph from 1969 to 2015 of Kuwait. No data until 1968. Number of actual observations by date: 47.
Source name:
World Development Indicators
Source organization:
Food and Agriculture Organization, electronic files and web site.
Categories, topics:
Agriculture & Rural Development
Last updated:
apr 23, 2017
Indicators value changes by year
Maximum:
2.454K
jan 1, 2015
At the date of observation
Value
Absolute change
Change from previous value
jan 1, 1970
3.0
+1.0
50.0%
jan 1, 1971
4.0
+1.0
33.33%
jan 1, 1972
5.0
+1.0
25.0%
jan 1, 1973
10.0
+5.0
100.0%
jan 1, 1974
9.0
-1.0
-10.0%
jan 1, 1975
4.0
-5.0
-55.56%
jan 1, 1976
14.0
+10.0
250.0%
jan 1, 1977
15.0
+1.0
7.14%
jan 1, 1978
13.0
-2.0
-13.33%
jan 1, 1979
44.0
+31.0
238.46%
jan 1, 1980
72.0
+28.0
63.64%
jan 1, 1981
69.0
-3.0
-4.17%
jan 1, 1982
135.0
+66.0
95.65%
jan 1, 1983
165.0
+30.0
22.22%
jan 1, 1984
256.0
+91.0
55.15%
jan 1, 1985
257.0
+1.0
0.39%
jan 1, 1986
591.0
+334.0
129.96%
jan 1, 1987
555.0
-36.0
-6.09%
jan 1, 1988
615.0
+60.0
10.81%
jan 1, 1989
699.0
+84.0
13.66%
jan 1, 1990
691.0
-8.0
-1.14%
jan 1, 1991
501.0
-190.0
-27.5%
jan 1, 1992
302.0
-199.0
-39.72%
jan 1, 1993
283.0
-19.0
-6.29%
jan 1, 1994
295.0
+12.0
4.24%
jan 1, 1995
308.0
+13.0
4.41%
jan 1, 1996
327.0
+19.0
6.17%
jan 1, 1997
547.0
+220.0
67.28%
jan 1, 1998
507.0
-40.0
-7.31%
jan 1, 1999
1.096K
+589.0
116.17%
jan 1, 2000
1.298K
+202.0
18.43%
jan 1, 2001
1.22K
-78.0
-6.01%
jan 1, 2002
1.598K
+378.0
30.98%
jan 1, 2003
1.919K
+321.0
20.09%
jan 1, 2004
1.231K
-688.0
-35.85%
jan 1, 2005
1.299K
+68.0
5.52%
jan 1, 2006
1.3K
+1.0
0.08%
jan 1, 2007
1.2K
-100.0
-7.69%
jan 1, 2008
1.02K
-180.0
-15.0%
jan 1, 2009
1.16K
+140.0
13.73%
jan 1, 2010
1.711K
+551.0
47.5%
jan 1, 2011
1.879K
+168.0
9.82%
jan 1, 2012
1.814K
-65.0
-3.46%
jan 1, 2013
2.413K
+599.0
33.02%
jan 1, 2014
2.08K
-333.0
-13.8%
jan 1, 2015
2.454K
+374.0
17.98%
Ranking of countries by current statistics by years


Comments: