29
/
en
AIzaSyAYiBZKx7MnpbEhh9jyipgxe19OcubqV5w
April 1, 2024
274930
United Arab Emirates
ARE
true
2
1
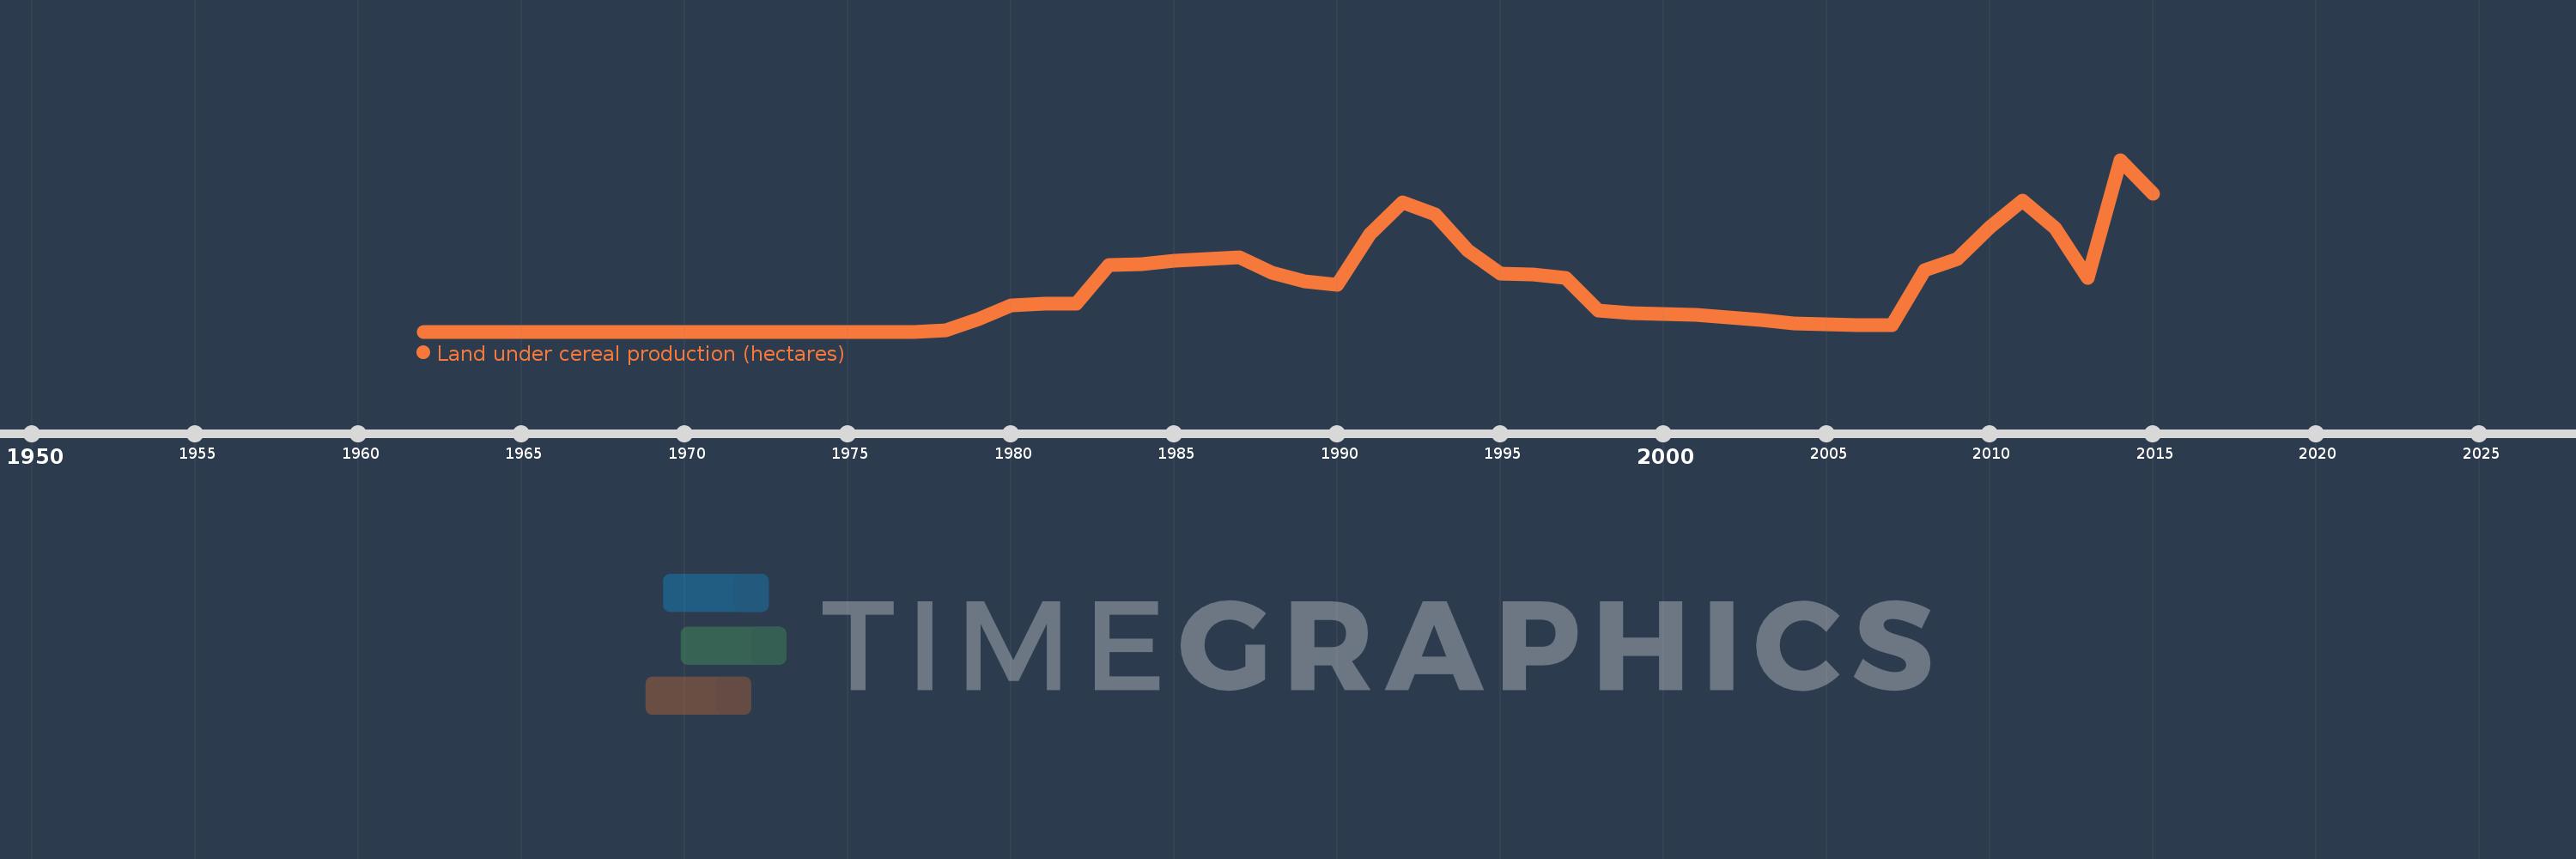
Land under cereal production (hectares)
2015,2014,2013,2012,2011,2010,2009,2008,2007,2006,2005,2004,2003,2002,2001,2000,1999,1998,1997,1996,1995,1994,1993,1992,1991,1990,1989,1988,1987,1986,1985,1984,1983,1982,1981,1980,1979,1978,1977,1976,1975,1974,1973,1972,1971,1970,1969,1968,1967,1966,1965,1964,1963,1962
This statistics in other country:
AfghanistanAlbaniaAlgeriaAngolaAntigua and BarbudaArab WorldArgentinaArmeniaAustraliaAustriaAzerbaijanBahamas, TheBangladeshBarbadosBelarusBelgiumBelizeBeninBhutanBoliviaBosnia and HerzegovinaBotswanaBrazilBrunei DarussalamBulgariaBurkina FasoBurundiCabo VerdeCambodiaCameroonCanadaCaribbean small statesCentral African RepublicCentral Europe and the BalticsChadChileChinaColombiaComorosCongo, Dem. Rep.Congo, Rep.Costa RicaCote d'IvoireCroatiaCubaCyprusCzech RepublicDenmarkDjiboutiDominicaDominican RepublicEarly-demographic dividendEast Asia & PacificEast Asia & Pacific (excluding high income)East Asia & Pacific (IDA & IBRD countries)EcuadorEgypt, Arab Rep.El SalvadorEritreaEstoniaEthiopiaEuro areaEurope & Central AsiaEurope & Central Asia (excluding high income)Europe & Central Asia (IDA & IBRD countries)European UnionFijiFinlandFragile and conflict affected situationsFranceGabonGambia, TheGeorgiaGermanyGhanaGreeceGrenadaGuamGuatemalaGuineaGuinea-BissauGuyanaHaitiHeavily indebted poor countries (HIPC)High incomeHondurasHong Kong SAR, ChinaHungaryIBRD onlyIDA & IBRD totalIDA blendIDA onlyIDA totalIndiaIndonesiaIran, Islamic Rep.IraqIrelandIsraelItalyJamaicaJapanJordanKazakhstanKenyaKorea, Dem. People’s Rep.Korea, Rep.KuwaitKyrgyz RepublicLao PDRLate-demographic dividendLatin America & Caribbean Latin America & Caribbean (excluding high income)Latin America & the Caribbean (IDA & IBRD countries)LatviaLeast developed countries: UN classificationLebanonLesothoLiberiaLibyaLithuaniaLow & middle incomeLow incomeLower middle incomeLuxembourgMacedonia, FYRMadagascarMalawiMalaysiaMaldivesMaliMaltaMauritaniaMauritiusMexicoMicronesia, Fed. Sts.Middle East & North AfricaMiddle East & North Africa (excluding high income)Middle East & North Africa (IDA & IBRD countries)Middle incomeMoldovaMongoliaMontenegroMoroccoMozambiqueMyanmarNamibiaNepalNetherlandsNew CaledoniaNew ZealandNicaraguaNigerNigeriaNorth AmericaNorwayOECD membersOmanOther small statesPacific island small statesPakistanPanamaPapua New GuineaParaguayPeruPhilippinesPolandPortugalPost-demographic dividendPre-demographic dividendPuerto RicoQatarRomaniaRussian FederationRwandaSao Tome and PrincipeSaudi ArabiaSenegalSerbiaSierra LeoneSlovak RepublicSloveniaSmall statesSolomon IslandsSomaliaSouth AfricaSouth AsiaSouth Asia (IDA & IBRD)South SudanSpainSri LankaSt. LuciaSt. Vincent and the GrenadinesSub-Saharan Africa Sub-Saharan Africa (excluding high income)Sub-Saharan Africa (IDA & IBRD countries)SudanSurinameSwazilandSwedenSwitzerlandSyrian Arab RepublicTajikistanTanzaniaThailandTimor-LesteTogoTrinidad and TobagoTunisiaTurkeyTurkmenistanUgandaUkraineUnited Arab EmiratesUnited KingdomUnited StatesUpper middle incomeUruguayUzbekistanVanuatuVenezuela, RBVietnamWest Bank and GazaWorldYemen, Rep.ZambiaZimbabwe Timeline:
This timeline shows a graph from 1962 to 2015 of United Arab Emirates. No data until 1961. Number of actual observations by date: 54.
Source name:
World Development Indicators
Source organization:
Food and Agriculture Organization, electronic files and web site.
Categories, topics:
Agriculture & Rural Development
Last updated:
apr 23, 2017
Indicators value changes by year
Maximum:
2.297K
jan 1, 2014
At the date of observation
Value
Absolute change
Change from previous value
jan 1, 1979
165.0
+153.0
1.27K%
jan 1, 1980
350.0
+185.0
112.12%
jan 1, 1981
376.0
+26.0
7.43%
jan 1, 1982
375.0
-1.0
-0.27%
jan 1, 1983
890.0
+515.0
137.33%
jan 1, 1984
900.0
+10.0
1.12%
jan 1, 1985
952.0
+52.0
5.78%
jan 1, 1986
970.0
+18.0
1.89%
jan 1, 1987
991.0
+21.0
2.16%
jan 1, 1988
790.0
-201.0
-20.28%
jan 1, 1989
673.0
-117.0
-14.81%
jan 1, 1990
624.0
-49.0
-7.28%
jan 1, 1991
1.298K
+674.0
108.01%
jan 1, 1992
1.726K
+428.0
32.97%
jan 1, 1993
1.562K
-164.0
-9.5%
jan 1, 1994
1.084K
-478.0
-30.6%
jan 1, 1995
772.0
-312.0
-28.78%
jan 1, 1996
768.0
-4.0
-0.52%
jan 1, 1997
723.0
-45.0
-5.86%
jan 1, 1998
283.0
-440.0
-60.86%
jan 1, 1999
252.0
-31.0
-10.95%
jan 1, 2000
239.0
-13.0
-5.16%
jan 1, 2001
225.0
-14.0
-5.86%
jan 1, 2002
192.0
-33.0
-14.67%
jan 1, 2003
157.0
-35.0
-18.23%
jan 1, 2004
105.0
-52.0
-33.12%
jan 1, 2005
94.0
-11.0
-10.48%
jan 1, 2006
86.0
-8.0
-8.51%
jan 1, 2007
83.0
-3.0
-3.49%
jan 1, 2008
816.0
+733.0
883.13%
jan 1, 2009
965.0
+149.0
18.26%
jan 1, 2010
1.393K
+428.0
44.35%
jan 1, 2011
1.757K
+364.0
26.13%
jan 1, 2012
1.381K
-376.0
-21.4%
jan 1, 2013
723.0
-658.0
-47.65%
jan 1, 2014
2.297K
+1.574K
217.7%
jan 1, 2015
1.848K
-449.0
-19.55%
Ranking of countries by current statistics by years


Comments: