29
/
en
AIzaSyAYiBZKx7MnpbEhh9jyipgxe19OcubqV5w
April 1, 2024
140613
Ghana
GHA
true
2
1
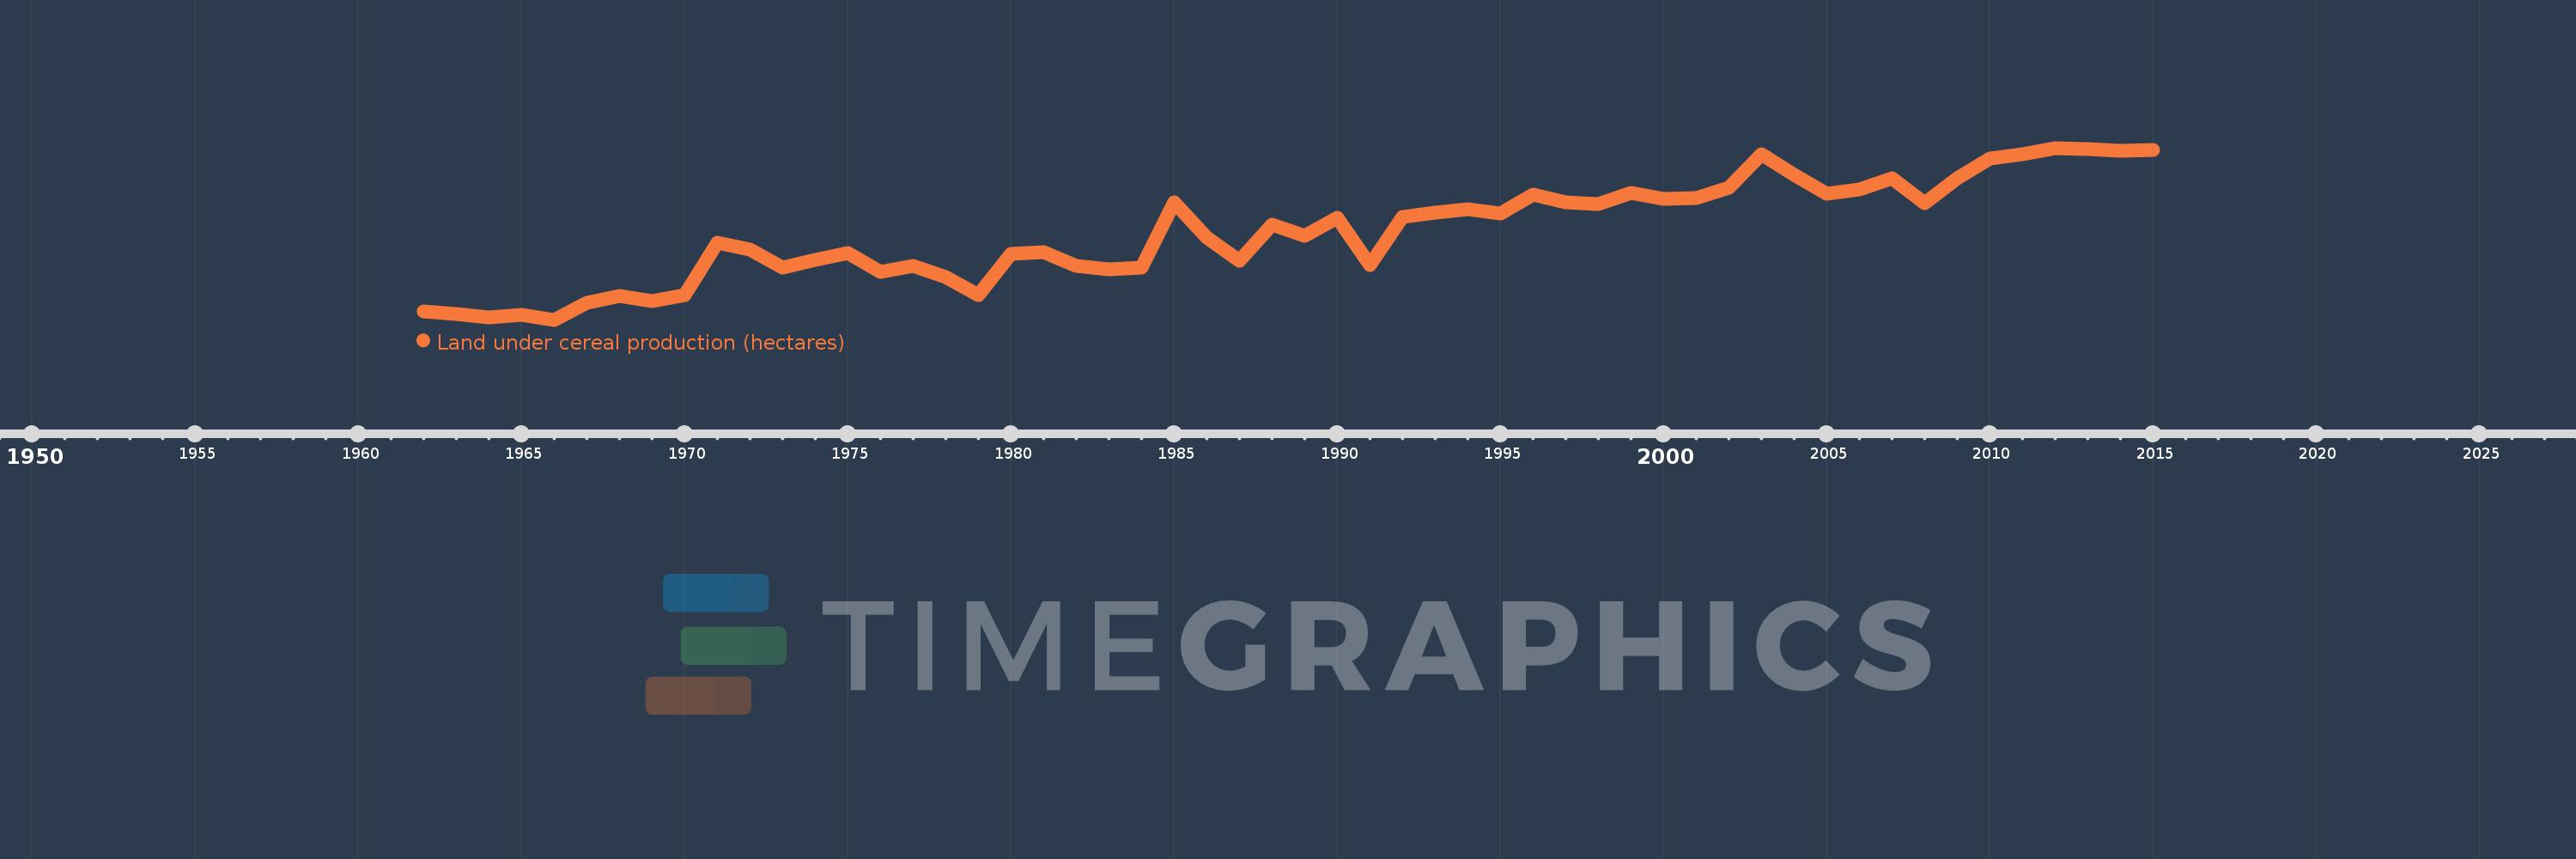
Land under cereal production (hectares)
2015,2014,2013,2012,2011,2010,2009,2008,2007,2006,2005,2004,2003,2002,2001,2000,1999,1998,1997,1996,1995,1994,1993,1992,1991,1990,1989,1988,1987,1986,1985,1984,1983,1982,1981,1980,1979,1978,1977,1976,1975,1974,1973,1972,1971,1970,1969,1968,1967,1966,1965,1964,1963,1962
This statistics in other country:
AfghanistanAlbaniaAlgeriaAngolaAntigua and BarbudaArab WorldArgentinaArmeniaAustraliaAustriaAzerbaijanBahamas, TheBangladeshBarbadosBelarusBelgiumBelizeBeninBhutanBoliviaBosnia and HerzegovinaBotswanaBrazilBrunei DarussalamBulgariaBurkina FasoBurundiCabo VerdeCambodiaCameroonCanadaCaribbean small statesCentral African RepublicCentral Europe and the BalticsChadChileChinaColombiaComorosCongo, Dem. Rep.Congo, Rep.Costa RicaCote d'IvoireCroatiaCubaCyprusCzech RepublicDenmarkDjiboutiDominicaDominican RepublicEarly-demographic dividendEast Asia & PacificEast Asia & Pacific (excluding high income)East Asia & Pacific (IDA & IBRD countries)EcuadorEgypt, Arab Rep.El SalvadorEritreaEstoniaEthiopiaEuro areaEurope & Central AsiaEurope & Central Asia (excluding high income)Europe & Central Asia (IDA & IBRD countries)European UnionFijiFinlandFragile and conflict affected situationsFranceGabonGambia, TheGeorgiaGermanyGhanaGreeceGrenadaGuamGuatemalaGuineaGuinea-BissauGuyanaHaitiHeavily indebted poor countries (HIPC)High incomeHondurasHong Kong SAR, ChinaHungaryIBRD onlyIDA & IBRD totalIDA blendIDA onlyIDA totalIndiaIndonesiaIran, Islamic Rep.IraqIrelandIsraelItalyJamaicaJapanJordanKazakhstanKenyaKorea, Dem. People’s Rep.Korea, Rep.KuwaitKyrgyz RepublicLao PDRLate-demographic dividendLatin America & Caribbean Latin America & Caribbean (excluding high income)Latin America & the Caribbean (IDA & IBRD countries)LatviaLeast developed countries: UN classificationLebanonLesothoLiberiaLibyaLithuaniaLow & middle incomeLow incomeLower middle incomeLuxembourgMacedonia, FYRMadagascarMalawiMalaysiaMaldivesMaliMaltaMauritaniaMauritiusMexicoMicronesia, Fed. Sts.Middle East & North AfricaMiddle East & North Africa (excluding high income)Middle East & North Africa (IDA & IBRD countries)Middle incomeMoldovaMongoliaMontenegroMoroccoMozambiqueMyanmarNamibiaNepalNetherlandsNew CaledoniaNew ZealandNicaraguaNigerNigeriaNorth AmericaNorwayOECD membersOmanOther small statesPacific island small statesPakistanPanamaPapua New GuineaParaguayPeruPhilippinesPolandPortugalPost-demographic dividendPre-demographic dividendPuerto RicoQatarRomaniaRussian FederationRwandaSao Tome and PrincipeSaudi ArabiaSenegalSerbiaSierra LeoneSlovak RepublicSloveniaSmall statesSolomon IslandsSomaliaSouth AfricaSouth AsiaSouth Asia (IDA & IBRD)South SudanSpainSri LankaSt. LuciaSt. Vincent and the GrenadinesSub-Saharan Africa Sub-Saharan Africa (excluding high income)Sub-Saharan Africa (IDA & IBRD countries)SudanSurinameSwazilandSwedenSwitzerlandSyrian Arab RepublicTajikistanTanzaniaThailandTimor-LesteTogoTrinidad and TobagoTunisiaTurkeyTurkmenistanUgandaUkraineUnited Arab EmiratesUnited KingdomUnited StatesUpper middle incomeUruguayUzbekistanVanuatuVenezuela, RBVietnamWest Bank and GazaWorldYemen, Rep.ZambiaZimbabwe Timeline:
This timeline shows a graph from 1962 to 2015 of Ghana. No data until 1961. Number of actual observations by date: 54.
Source name:
World Development Indicators
Source organization:
Food and Agriculture Organization, electronic files and web site.
Categories, topics:
Agriculture & Rural Development
Last updated:
apr 23, 2017
Indicators value changes by year
Minimum:
480.68K
jan 1, 1966
Maximum:
1.643 mln
jan 1, 2012
At the date of observation
Value
Absolute change
Change from previous value
jan 1, 1962
534.518K
+534.518K
0.0%
jan 1, 1963
520.0K
-14.518K
-2.72%
jan 1, 1964
497.756K
-22.244K
-4.28%
jan 1, 1965
514.672K
+16.916K
3.4%
jan 1, 1966
480.68K
-33.992K
-6.6%
jan 1, 1967
594.2K
+113.52K
23.62%
jan 1, 1968
639.305K
+45.105K
7.59%
jan 1, 1969
608.229K
-31.076K
-4.86%
jan 1, 1970
649.182K
+40.953K
6.73%
jan 1, 1971
999.2K
+350.018K
53.92%
jan 1, 1972
956.3K
-42.9K
-4.29%
jan 1, 1973
834.4K
-121.9K
-12.75%
jan 1, 1974
884.7K
+50.3K
6.03%
jan 1, 1975
930.0K
+45.3K
5.12%
jan 1, 1976
804.9K
-125.1K
-13.45%
jan 1, 1977
843.4K
+38.5K
4.78%
jan 1, 1978
768.0K
-75.4K
-8.94%
jan 1, 1979
645.0K
-123.0K
-16.02%
jan 1, 1980
924.0K
+279.0K
43.26%
jan 1, 1981
939.0K
+15.0K
1.62%
jan 1, 1982
843.0K
-96.0K
-10.22%
jan 1, 1983
822.0K
-21.0K
-2.49%
jan 1, 1984
835.0K
+13.0K
1.58%
jan 1, 1985
1.276 mln
+441.0K
52.81%
jan 1, 1986
1.034 mln
-242.0K
-18.97%
jan 1, 1987
880.1K
-153.9K
-14.88%
jan 1, 1988
1.127 mln
+246.5K
28.01%
jan 1, 1989
1.046 mln
-80.8K
-7.17%
jan 1, 1990
1.169 mln
+122.8K
11.74%
jan 1, 1991
853.0K
-315.6K
-27.01%
jan 1, 1992
1.176 mln
+323.4K
37.91%
jan 1, 1993
1.204 mln
+27.1K
2.3%
jan 1, 1994
1.227 mln
+23.7K
1.97%
jan 1, 1995
1.201 mln
-26.5K
-2.16%
jan 1, 1996
1.327 mln
+126.3K
10.52%
jan 1, 1997
1.274 mln
-52.87K
-3.98%
jan 1, 1998
1.263 mln
-11.201K
-0.88%
jan 1, 1999
1.34 mln
+77.211K
6.11%
jan 1, 2000
1.3 mln
-40.209K
-3.0%
jan 1, 2001
1.307 mln
+6.701K
0.52%
jan 1, 2002
1.371 mln
+64.817K
4.96%
jan 1, 2003
1.598 mln
+226.154K
16.49%
jan 1, 2004
1.462 mln
-136.069K
-8.52%
jan 1, 2005
1.333 mln
-128.814K
-8.81%
jan 1, 2006
1.36 mln
+27.315K
2.05%
jan 1, 2007
1.438 mln
+78.001K
5.74%
jan 1, 2008
1.27 mln
-167.818K
-11.67%
jan 1, 2009
1.437 mln
+166.973K
13.15%
jan 1, 2010
1.571 mln
+133.553K
9.29%
jan 1, 2011
1.602 mln
+31.355K
2.0%
jan 1, 2012
1.643 mln
+40.767K
2.54%
jan 1, 2013
1.635 mln
-7.893K
-0.48%
jan 1, 2014
1.626 mln
-9.003K
-0.55%
jan 1, 2015
1.632 mln
+6.075K
0.37%
Ranking of countries by current statistics by years


Comments: