29
/
en
AIzaSyAYiBZKx7MnpbEhh9jyipgxe19OcubqV5w
April 1, 2024
282502
Vietnam
VNM
true
2
1
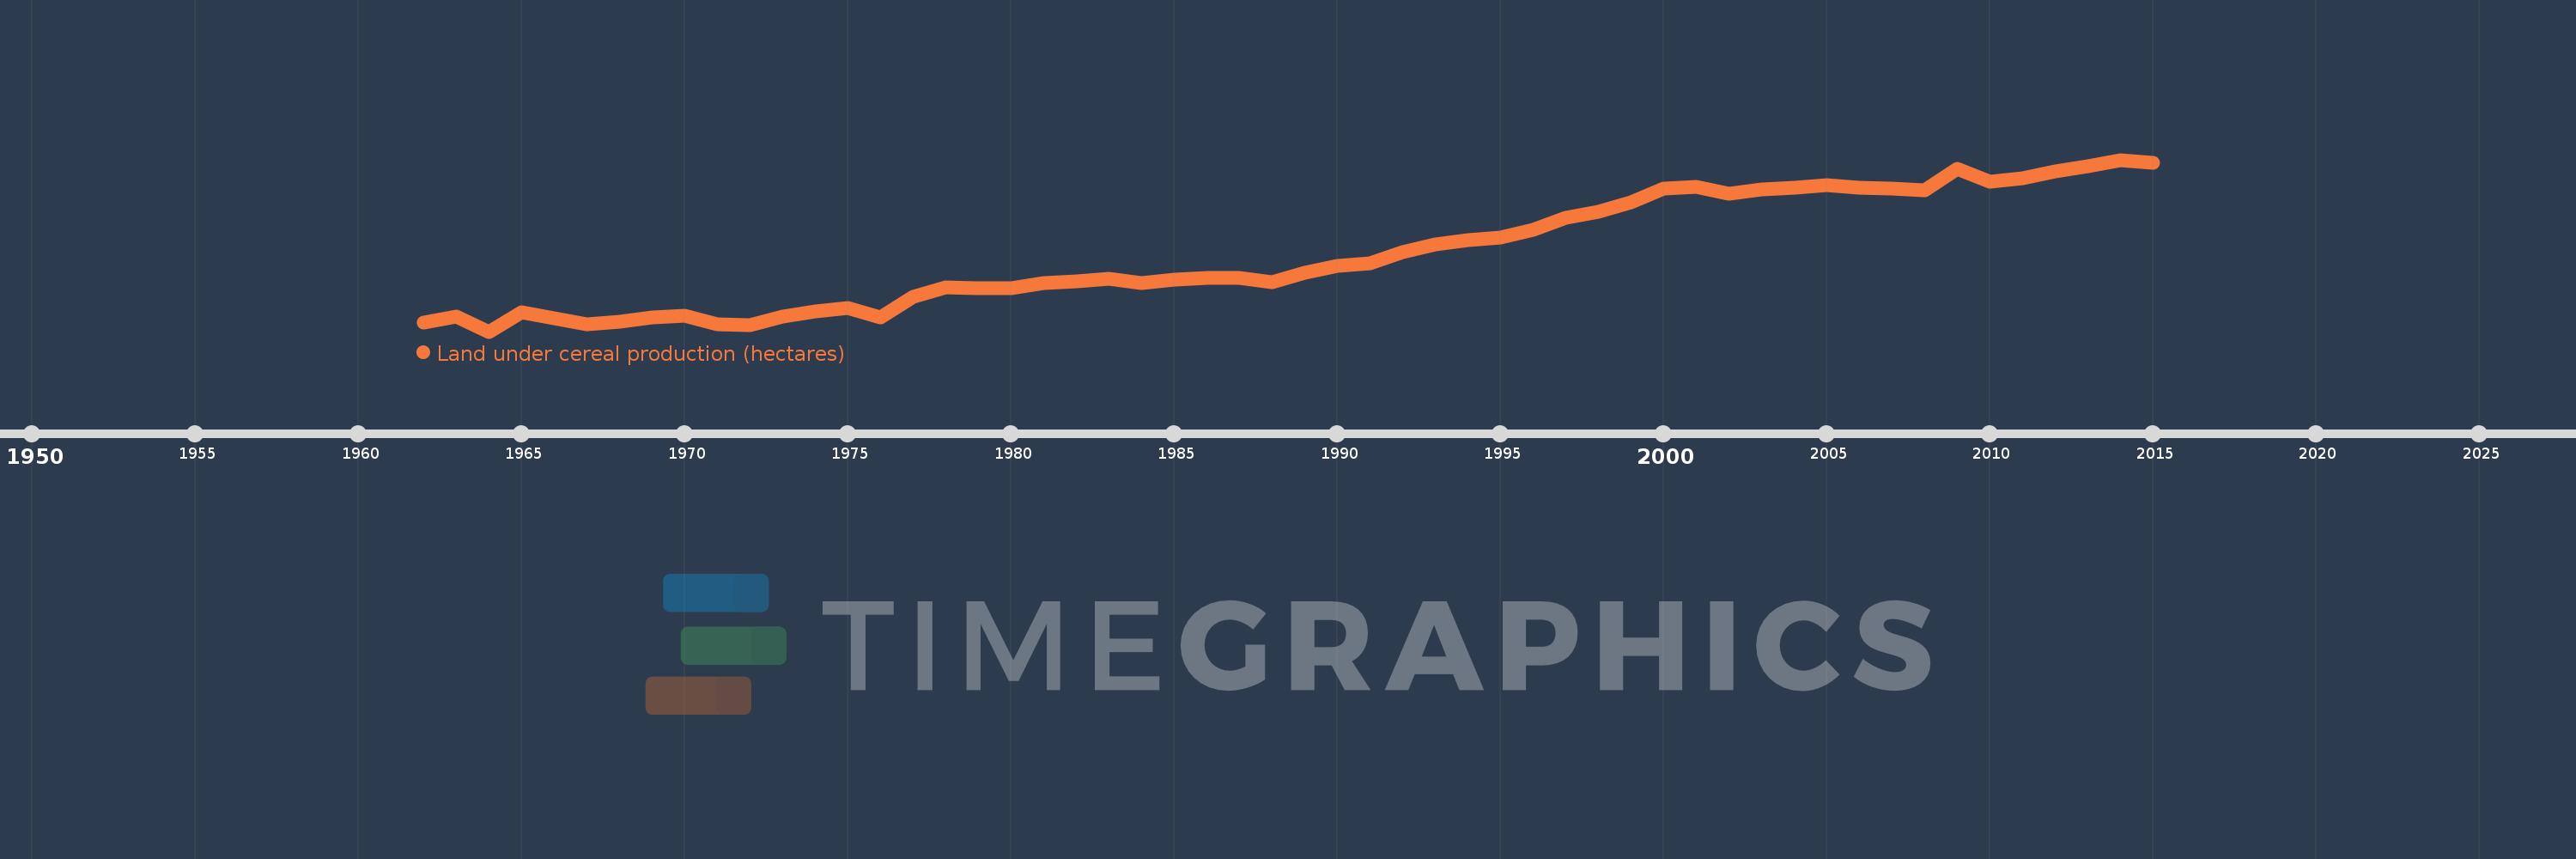
Land under cereal production (hectares)
2015,2014,2013,2012,2011,2010,2009,2008,2007,2006,2005,2004,2003,2002,2001,2000,1999,1998,1997,1996,1995,1994,1993,1992,1991,1990,1989,1988,1987,1986,1985,1984,1983,1982,1981,1980,1979,1978,1977,1976,1975,1974,1973,1972,1971,1970,1969,1968,1967,1966,1965,1964,1963,1962
This statistics in other country:
AfghanistanAlbaniaAlgeriaAngolaAntigua and BarbudaArab WorldArgentinaArmeniaAustraliaAustriaAzerbaijanBahamas, TheBangladeshBarbadosBelarusBelgiumBelizeBeninBhutanBoliviaBosnia and HerzegovinaBotswanaBrazilBrunei DarussalamBulgariaBurkina FasoBurundiCabo VerdeCambodiaCameroonCanadaCaribbean small statesCentral African RepublicCentral Europe and the BalticsChadChileChinaColombiaComorosCongo, Dem. Rep.Congo, Rep.Costa RicaCote d'IvoireCroatiaCubaCyprusCzech RepublicDenmarkDjiboutiDominicaDominican RepublicEarly-demographic dividendEast Asia & PacificEast Asia & Pacific (excluding high income)East Asia & Pacific (IDA & IBRD countries)EcuadorEgypt, Arab Rep.El SalvadorEritreaEstoniaEthiopiaEuro areaEurope & Central AsiaEurope & Central Asia (excluding high income)Europe & Central Asia (IDA & IBRD countries)European UnionFijiFinlandFragile and conflict affected situationsFranceGabonGambia, TheGeorgiaGermanyGhanaGreeceGrenadaGuamGuatemalaGuineaGuinea-BissauGuyanaHaitiHeavily indebted poor countries (HIPC)High incomeHondurasHong Kong SAR, ChinaHungaryIBRD onlyIDA & IBRD totalIDA blendIDA onlyIDA totalIndiaIndonesiaIran, Islamic Rep.IraqIrelandIsraelItalyJamaicaJapanJordanKazakhstanKenyaKorea, Dem. People’s Rep.Korea, Rep.KuwaitKyrgyz RepublicLao PDRLate-demographic dividendLatin America & Caribbean Latin America & Caribbean (excluding high income)Latin America & the Caribbean (IDA & IBRD countries)LatviaLeast developed countries: UN classificationLebanonLesothoLiberiaLibyaLithuaniaLow & middle incomeLow incomeLower middle incomeLuxembourgMacedonia, FYRMadagascarMalawiMalaysiaMaldivesMaliMaltaMauritaniaMauritiusMexicoMicronesia, Fed. Sts.Middle East & North AfricaMiddle East & North Africa (excluding high income)Middle East & North Africa (IDA & IBRD countries)Middle incomeMoldovaMongoliaMontenegroMoroccoMozambiqueMyanmarNamibiaNepalNetherlandsNew CaledoniaNew ZealandNicaraguaNigerNigeriaNorth AmericaNorwayOECD membersOmanOther small statesPacific island small statesPakistanPanamaPapua New GuineaParaguayPeruPhilippinesPolandPortugalPost-demographic dividendPre-demographic dividendPuerto RicoQatarRomaniaRussian FederationRwandaSao Tome and PrincipeSaudi ArabiaSenegalSerbiaSierra LeoneSlovak RepublicSloveniaSmall statesSolomon IslandsSomaliaSouth AfricaSouth AsiaSouth Asia (IDA & IBRD)South SudanSpainSri LankaSt. LuciaSt. Vincent and the GrenadinesSub-Saharan Africa Sub-Saharan Africa (excluding high income)Sub-Saharan Africa (IDA & IBRD countries)SudanSurinameSwazilandSwedenSwitzerlandSyrian Arab RepublicTajikistanTanzaniaThailandTimor-LesteTogoTrinidad and TobagoTunisiaTurkeyTurkmenistanUgandaUkraineUnited Arab EmiratesUnited KingdomUnited StatesUpper middle incomeUruguayUzbekistanVanuatuVenezuela, RBVietnamWest Bank and GazaWorldYemen, Rep.ZambiaZimbabwe Timeline:
This timeline shows a graph from 1962 to 2015 of Vietnam. No data until 1961. Number of actual observations by date: 54.
Source name:
World Development Indicators
Source organization:
Food and Agriculture Organization, electronic files and web site.
Categories, topics:
Agriculture & Rural Development
Last updated:
apr 23, 2017
Indicators value changes by year
Minimum:
4.769 mln
jan 1, 1964
Maximum:
9.074 mln
jan 1, 2014
At the date of observation
Value
Absolute change
Change from previous value
jan 1, 1962
5.004 mln
+5.004 mln
0.0%
jan 1, 1963
5.151 mln
+146.68K
2.93%
jan 1, 1964
4.769 mln
-381.61K
-7.41%
jan 1, 1965
5.245 mln
+475.53K
9.97%
jan 1, 1966
5.104 mln
-141.1K
-2.69%
jan 1, 1967
4.949 mln
-154.9K
-3.04%
jan 1, 1968
5.026 mln
+77.0K
1.56%
jan 1, 1969
5.133 mln
+107.0K
2.13%
jan 1, 1970
5.172 mln
+39.2K
0.76%
jan 1, 1971
4.958 mln
-213.9K
-4.14%
jan 1, 1972
4.928 mln
-29.9K
-0.6%
jan 1, 1973
5.136 mln
+207.3K
4.21%
jan 1, 1974
5.27 mln
+134.5K
2.62%
jan 1, 1975
5.362 mln
+91.92K
1.74%
jan 1, 1976
5.123 mln
-238.92K
-4.46%
jan 1, 1977
5.634 mln
+510.9K
9.97%
jan 1, 1978
5.872 mln
+237.7K
4.22%
jan 1, 1979
5.855 mln
-16.6K
-0.28%
jan 1, 1980
5.859 mln
+4.5K
0.08%
jan 1, 1981
5.99 mln
+130.3K
2.22%
jan 1, 1982
6.037 mln
+46.7K
0.78%
jan 1, 1983
6.093 mln
+56.6K
0.94%
jan 1, 1984
5.99 mln
-103.1K
-1.69%
jan 1, 1985
6.061 mln
+71.5K
1.19%
jan 1, 1986
6.116 mln
+54.1K
0.89%
jan 1, 1987
6.104 mln
-11.6K
-0.19%
jan 1, 1988
6.009 mln
-95.3K
-1.56%
jan 1, 1989
6.251 mln
+242.6K
4.04%
jan 1, 1990
6.421 mln
+169.3K
2.71%
jan 1, 1991
6.475 mln
+54.0K
0.84%
jan 1, 1992
6.75 mln
+275.7K
4.26%
jan 1, 1993
6.953 mln
+203.1K
3.01%
jan 1, 1994
7.056 mln
+102.5K
1.47%
jan 1, 1995
7.133 mln
+77.4K
1.1%
jan 1, 1996
7.322 mln
+189.1K
2.65%
jan 1, 1997
7.619 mln
+296.6K
4.05%
jan 1, 1998
7.763 mln
+143.6K
1.88%
jan 1, 1999
8.012 mln
+249.8K
3.22%
jan 1, 2000
8.347 mln
+334.9K
4.18%
jan 1, 2001
8.398 mln
+50.983K
0.61%
jan 1, 2002
8.224 mln
-174.322K
-2.08%
jan 1, 2003
8.322 mln
+98.503K
1.2%
jan 1, 2004
8.367 mln
+44.336K
0.53%
jan 1, 2005
8.438 mln
+71.0K
0.85%
jan 1, 2006
8.383 mln
-54.4K
-0.64%
jan 1, 2007
8.359 mln
-24.036K
-0.29%
jan 1, 2008
8.305 mln
-54.479K
-0.65%
jan 1, 2009
8.842 mln
+536.856K
6.46%
jan 1, 2010
8.528 mln
-314.103K
-3.55%
jan 1, 2011
8.617 mln
+89.289K
1.05%
jan 1, 2012
8.778 mln
+160.875K
1.87%
jan 1, 2013
8.918 mln
+140.681K
1.6%
jan 1, 2014
9.074 mln
+155.57K
1.74%
jan 1, 2015
8.996 mln
-77.886K
-0.86%
Ranking of countries by current statistics by years


Comments: